Break daily Trend and retest it, so the next step going to 100k
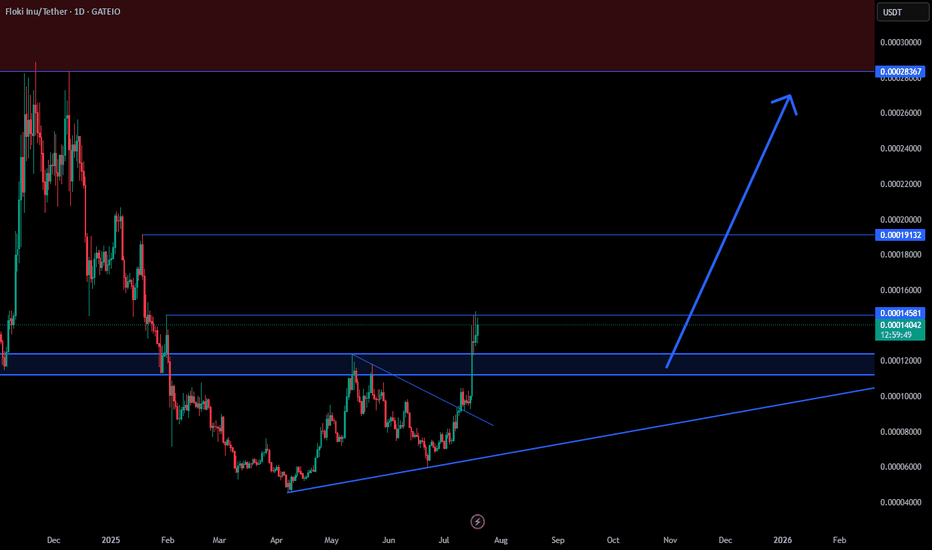
📊 FLOKI/USDT Analysis Floki just broke out of a falling wedge and flipped key resistance around 0.00012 into support. As long as price holds above this zone, I’m targeting the next major resistance levels at 0.00019 and 0.00028. ✅ Bullish market structure with strong momentum. ✅ Potential for a big move if current breakout holds.
BTC is still moving inside the falling wedge. A bounce from the lower boundary could trigger a breakout and push price toward $130,000 in the coming weeks.
BTC trying to broke out of the falling channel, the next target is $126000
📊 Ethereum – Long range outlook If the price manages to break the red resistance zone above and hold above it, the path will be poised to reach the main target at $15,000, as shown by the rising arrows. If it fails, it has another opportunity to regroup buyers from the resistance at $2,228, with a very important trend that will support the upward move. If the...
📊 Bitcoin Possible Scenarios (BTC/USDT Analysis) 🟢 Green Scenario (Immediate Bullish Breakout): If the price breaks above the $120,000 resistance without any significant pullback, this would signal strong bullish continuation. It suggests buyer dominance and could lead to a fast move toward higher levels. 🟡 Yellow Scenario (Bullish Correction): If BTC fails to...
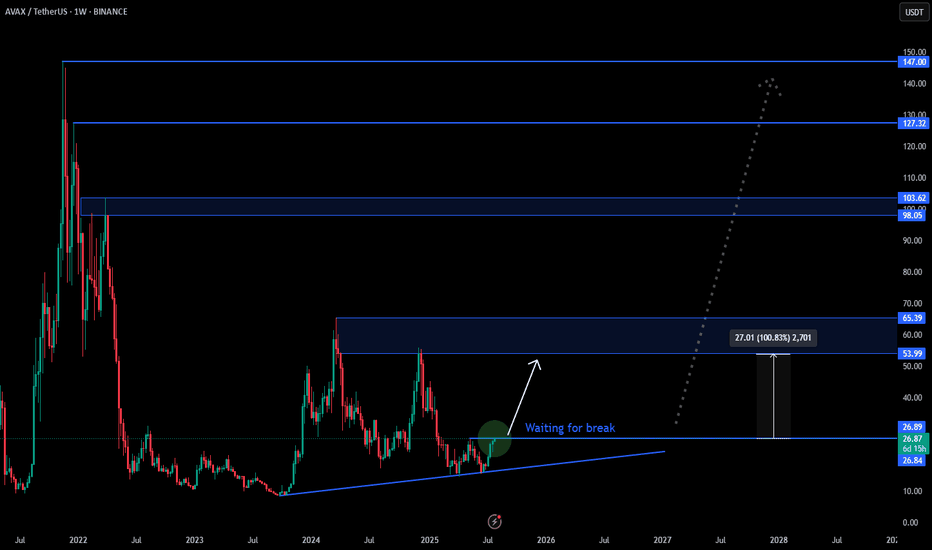
Price is at a strong bottom — one of the best buying zones. Just need a break above $27 to confirm the move.
BNB has clearly broken above a key resistance zone between $793 and $820. The weekly close above this level is a strong bullish signal. ✅ If price holds above this area, the path toward $1000 becomes technically easy and highly likely, supported by a steady long-term uptrend. 📌 Summary: Holding above $820 could lead BNB directly to $1000, with a possible retest...
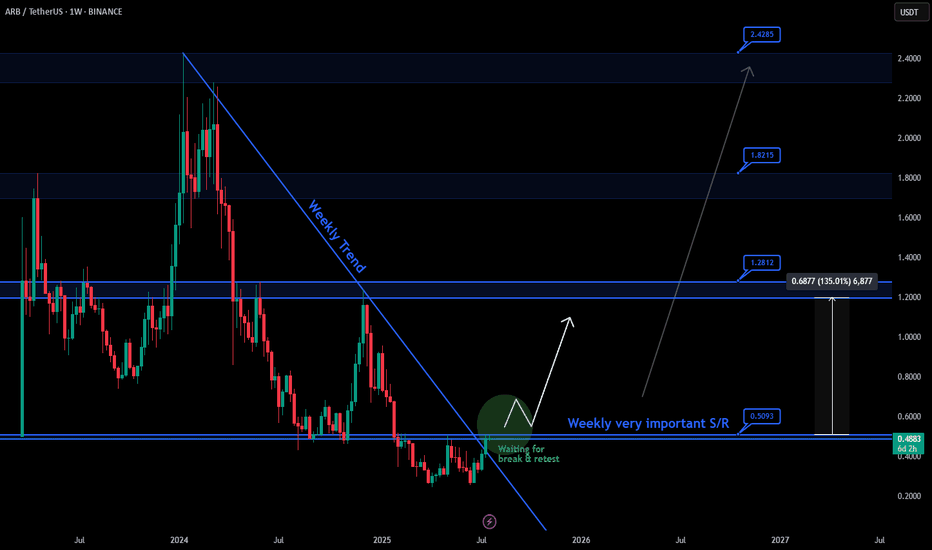
On the weekly chart, ARB is facing a clear long-term downtrend line. Currently, price is approaching a very important weekly resistance zone around $0.5, which has been tested multiple times. ✅ A confirmed breakout and retest above $0.5 could open the way for higher targets like 1.2$ and more ... 📌 Summary: Bullish scenario only valid after a clean breakout and...
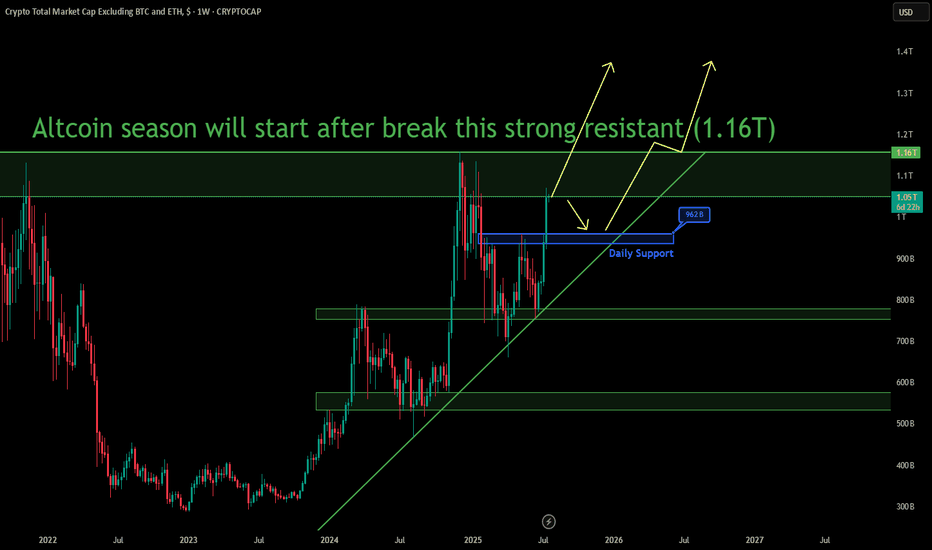
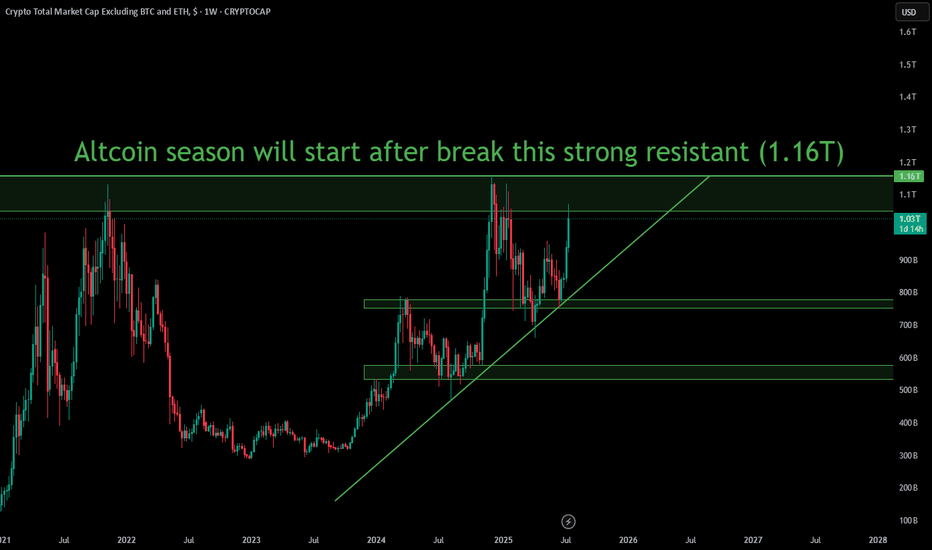
The market structure remains bullish, supported by a strong upward trendline that has held firm since early 2024. Price continues to respect major support levels during pullbacks. 🔸 The key resistance level is at $1.16T, which has acted as a strong barrier in the past. A confirmed breakout above this zone could signal the beginning of a strong Altcoin Season,...
📊 Altcoin Market Cap (TOTAL3) Analysis Currently, we are approaching a strong resistance zone at $1.16 Trillion. As shown on the chart, this level has acted as a major rejection point in the past, causing significant pullbacks. ✅ If we get a clear weekly candle close above this resistance, we can expect the Altcoin Season to officially begin 🚀. ✅ The market...


