imkeshav
PremiumWe maybe seeing A wave playing out of an ABC correction, more details in chart
We were in a simililar situation last year where BCH consolidated for a while a exploded later. We have a fork approching on Nov15 and the bull appears to be strong. More details in chart
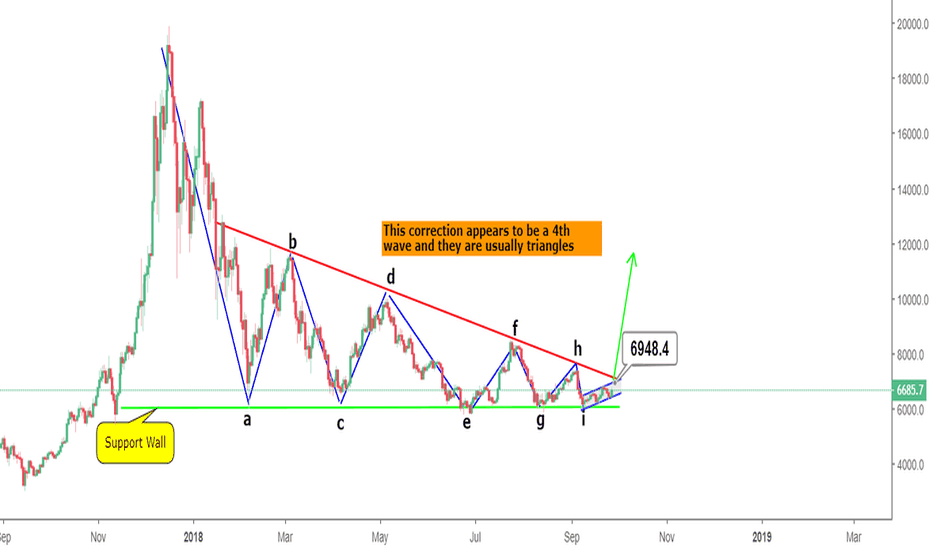
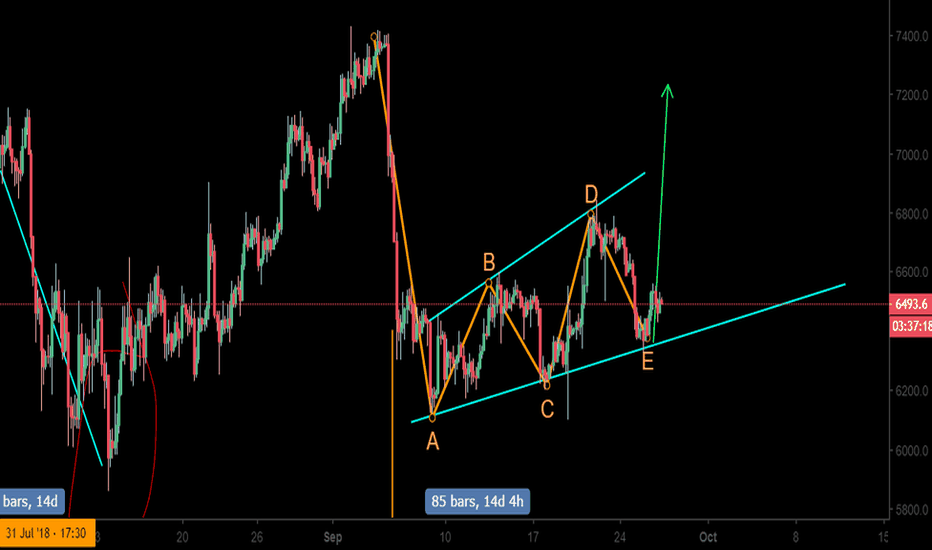
I think Yes. If this is 4th wave, they are usually triangles and since wave 2 was sharper. This appears to be close to the end considering there is a decent consolidation happening and 6k wall has held so many times Also I won't be too shocked if there is a capitulation spike down of $500+, will shake out the last HODLers
Bitcoin Cash is at a 90% discount, get it while the sale is on
For the first since the beginning of this bear run, the price is not going down vertically. Instead its totally flat with a recent spike up. Is this accumulation? Ask yourself, are you all in or waiting for bottoming out? Be Aware. Be Safe
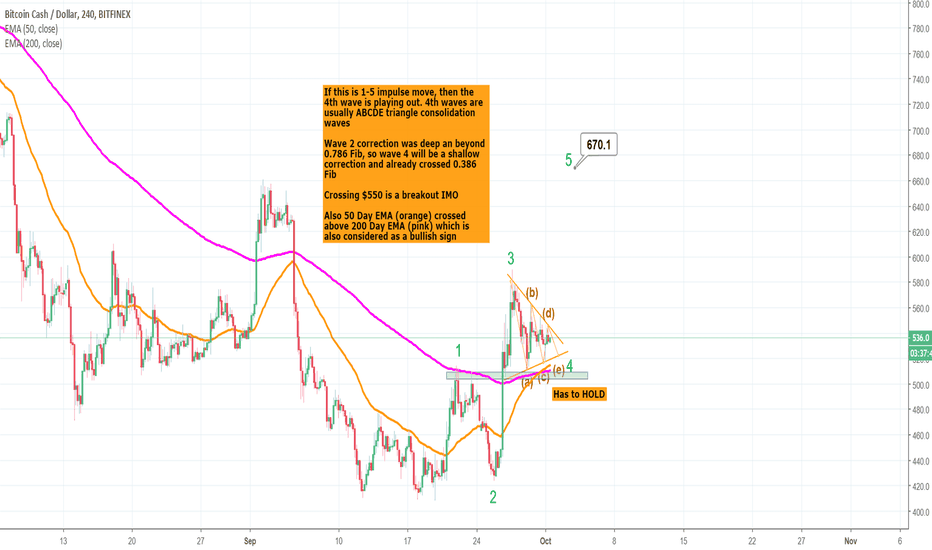
The night's watch has repelled the giant bears 8 times@$500-510 support wall. This is incredible and necessary for our Elliott Wave structure to be valid for a final 5th wave push beyond $650 To have a safer trade, you can enter a long after $550 All hail Lord commander Roger Ver More details for EW
The daily chart never managed to cross 50 Day EMA (Orange) since May and every reject bought lower lows. This time, price is facing resistance at 50 Day EMA and support at 20 Day EMA. There has to be a break out in in any direction and it will be violent. We need to stay above $500 to be bullish. Be Aware. Be Safe p.s - See related linked charts for more details
We may have 1 more 5th wave to a target of $650-670 if this impulse 1-5 plays out. However, we need to have a correction before that. The price going below $500 will invalidate the count Its also positive that price has broken out of the downward wedge formation decisively. Also we can see that overall correction appears to be over with a major ABC completion...
BTC found resistance again at the downward trend-line. The price is getting squeezed tighter and tighter, it will eventually burst out in either direction. I'm learning towards an upward hike Be Aware. Be Safe
Why do I keep seeing bullish patterns after BCH dropped 90%? Is it because the most profitable company (Bitmain) in Crypto hold a million coins? or is it because the network was able to handle 2 million transactions in a day keeping the fees super low? Maybe its because tokens can now be created on top of its blockchain? Time to be a investor, not a...
4th wave appears to be ending as a triangle (as they usually do). Note that we need to hold above $500-510 for this structure to be valid, also 200 Day EMA (pink) is adding support at 510. Breakout can be considered above $550 50 Day EMA (orange) has crossed 200 Day EMA which is bullish. All the best. Be Aware Be Safe
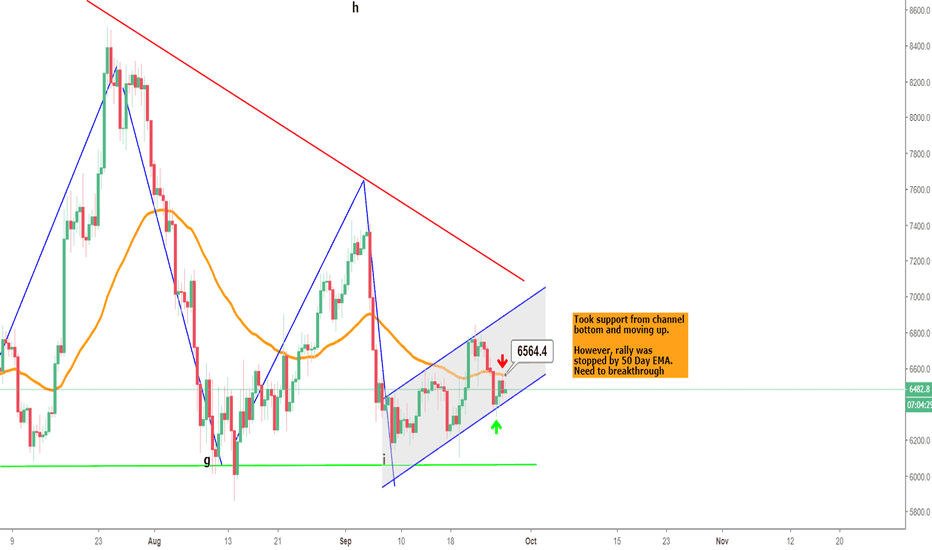
BTC took support from the channel bottom yesterday, but found resistance at the 50 Day EMA (orange). We need to take it out for more upside while still remaining within the boundaries On 4H timeframe
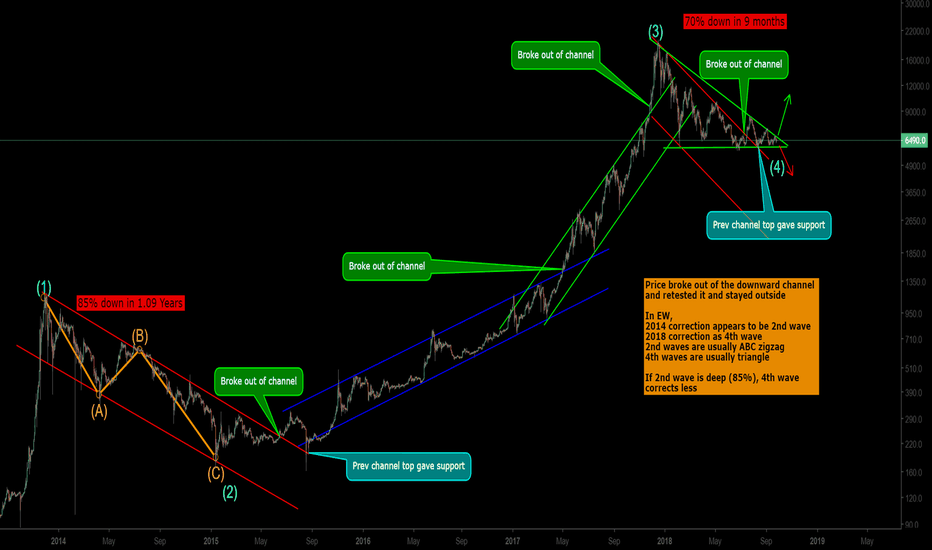
We appear to be in the 4th wave and they are usually ABCDE triangle corrections. Also if 2nd wave (in 2014) is deep correction of 85% from ATH, 4th wave should be less. Watch out for a breakout, BUT going below the support of 5.7-6k wall is bearish Notice how the price broke out from the downward red channel, retested it and stayed outside of it. This is very...
The "Elliott Wave Principle: Key to Market Behavior" has a chart showing a nine wave EW correction/consolidation and if our prior chart is correct and this is a 4th wave, this makes sense because 4th waves are usually triangles Reference:- oceanicfxsite.files.wordpress.com I'm also impressed that the support has held so well. This pattern gets confirmed after a...
I'm not entirely sure if this will go upside, but very likely to reach 6900 as target
Notice the pattern of double tops coincides with RSI being overbought. Do you think it will repeat this time?
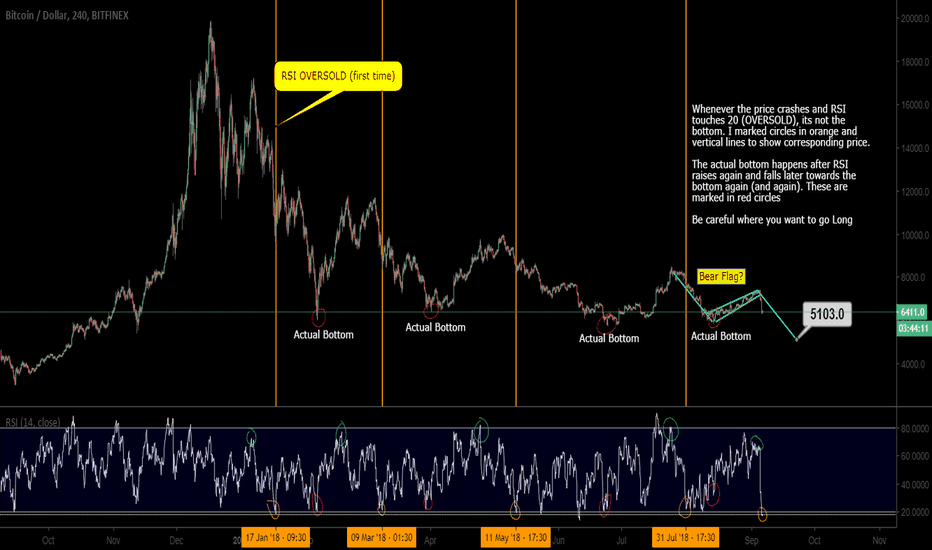
The 4Hour chart shows RSI below 20, which is OVERSOLD. But before you invest, know that its not the actual bottom Whenever the price crashes and RSI touches 20 (OVERSOLD), its not the bottom. I marked circles in orange and vertical lines to show corresponding price. The actual bottom happens after RSI raises again and falls later towards the bottom (RSI=20-30)...


