jmancharts
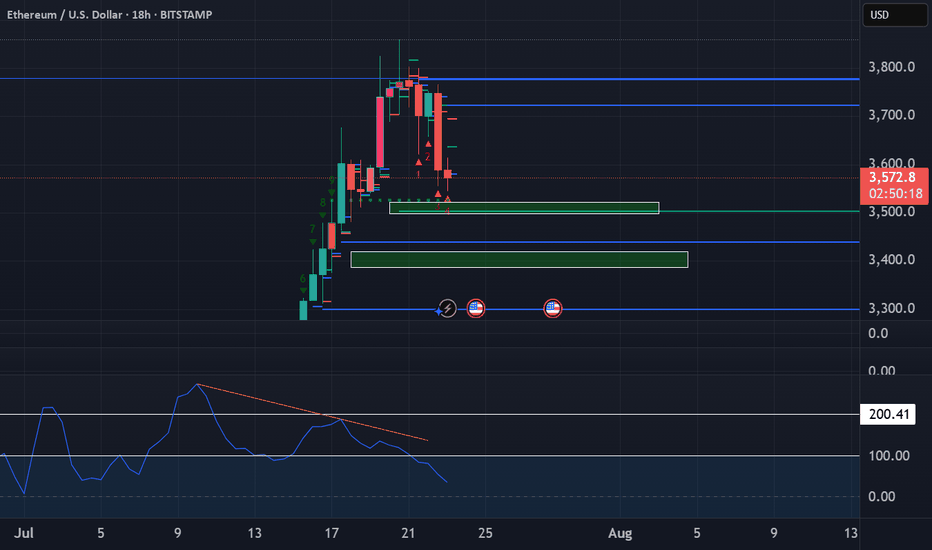
PlusToday we are measuring the difference between Ethereum's current price and its average price over a specific period. We see how far the current price deviates from its statistical average. This helps traders identify potential overbought and oversold conditions. Even though institutions and etfs have bought up over 32x the supply of Ether since May, it has showed...
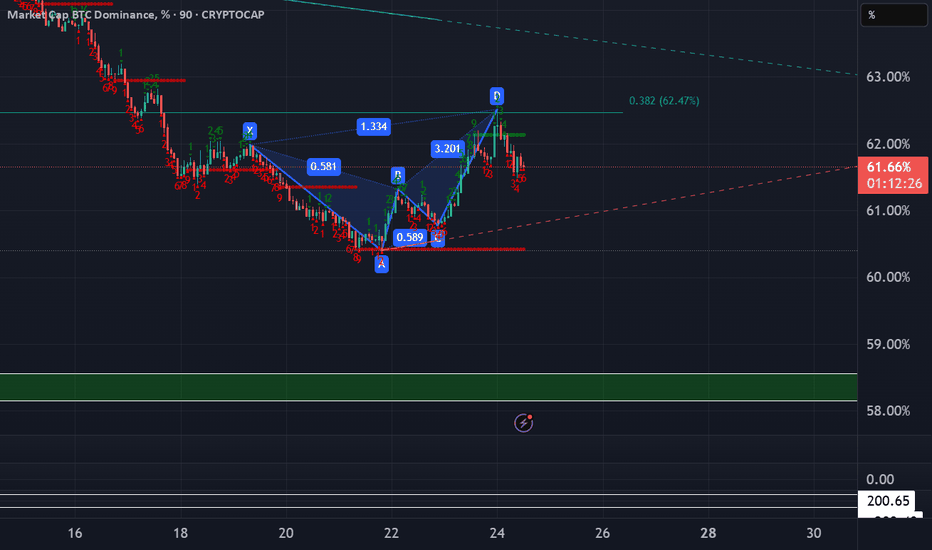
Despite the recent aggressive fall in BTC Dominance, we still see a path down towards 58%. This ratio, which is determined by dividing the total value of the cryptocurrency market by the market value of Bitcoin, can help us understand where the market will go.
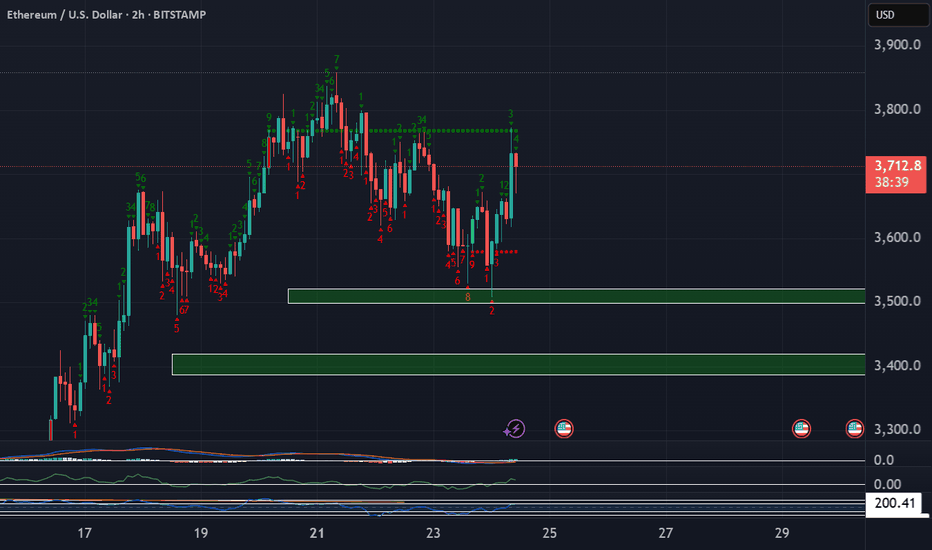
These zones are significant because they represent areas where large institutions and professional traders are likely to be active, potentially causing strong price movements when those orders are triggered. We want to enter trades that have minimal drawdown to maximize our buying power.
Don't be surprised to see some buying coming into play at the POI's highlighted below. Hedging involves entering into a trade that is expected to perform in the opposite direction of an existing position, effectively protecting against potential losses.
ADA/USD Cardano has hit its bottom of the ABC correction. The bounce from support has been verified. It appears the correction has ended and the wave 3 impulse could be in full motion. A - Plan your profit taking strategies for the way up. B - Diamond hand your position as it will be a volatile ride. Good luck traders!
Coinbasepro: Eth/Usd - Ethereum recently hit its mid-term top target at approx. $4,900. - As seen in the illustrated chart, we bounced from the 0.5% fib level. - If structure is lost at $4,100, likewise a snowball effect could take Eth down to the .786 fib. Good luck to everyone getting there buys in!
JasmyUSD: Coinbase Pro - Jasmy, newly listed on Coinbase has big potential for upside movement in the coming weeks. - Watch and wait to open a long position at the breakout of the symmetrical triangle.
Kryll/USD: Coinbase Pro - Kryll is a trading platform that was launched in 2018. The asset recently launched on Coinbase Pro in early November. - After a recent 40% pullback, market cap of just 100 million. This one is poised to climb! Comment with your thoughts, smash a like and follow!
Coinbasepro: MATICUSD 4 hr chart Matic is poised for continuation after breaking symmetrical triangle on the 4hr chart. - Mac D indicates buying pressure is increasing. - The Rsi has broke the downtrend, currently in a bullish reversal. Profit Targets: TP 1- $2.09 TP 2- $2.25 TP 3- $2.40 stop loss- $1.60
COINBASEPRO: AXSUSD 4 HR Chart - Axie is looking very good. - The price has been in accumulation since early October. - We have had a sharp recovery after retesting the bottom of the symmetrical triangle. - The price is now breaking the trend line at $133, a long position is now available with the conformation of the breakout. (4hr candle closure) . Profit...
Good evening everyone! Atom has formed a descending wedge pattern with a possible sign of a clear breakout. - Watch for price action to retest the 23.6% fib. This could be a good buying opportunity. - If the 23.6% fib is lost look for a double bottom closer to $30 for an even better buying opportunity. - When the breakout is confirmed, look for a TP near the 78.6%...
Matic Usd is finally taking off! - Breakout confirmed on the 4hr - Inverse head and shoulders pattern is coming to completion with great price targets ahead! - If we can hold support at the 32.8% Fib, ($1.46) it would not hurt to take profit as resistance levels are broken ahead. - After breaking the all time high, we will enter price discovery mode. - Buy the...
XLM broke out of the symmetrical triangle that has been formed in the past weeks of price action. - Price action came back down and tested the breakout, if we don't see continuation to our first target of 0.41, I expect us to consolidate or test the golden fib that sits at 0.34 - watch as BTC will influence price action. Congrats to anyone that bought the dip yesterday!
- As seen from the illustrated chart, we broke down from the 3.10 level and met our shorted target (vertical green arrow.) - While we continue to build up momentum heading sideways in the descending triangle our next key target of resistance is the 0.786 Fib @ 2.92. - After breaking this level with continuation to the upside, the Mid term target stands at the...


