kentacuna88
A bullish divergence occurs when the RSI displays an oversold reading followed by a higher low that appears with lower lows in the price.
Technical analysis looks at the price movement of a security and uses this data to attempt to predict future price movements. Fundamental analysis instead looks at economic and financial factors that influence a business.
Technical analysis looks at the price movement of a security and uses this data to attempt to predict future price movements. Fundamental analysis instead looks at economic and financial factors that influence a business.
The U.S. dollar index (USDX) is a measure of the value of the U.S. dollar relative to a basket of foreign currencies. The USDX was established by the U.S. Federal Reserve in 1973 after the dissolution of the Bretton Woods Agreement. It is now maintained by ICE Data Indices, a subsidiary of the Intercontinental Exchange (ICE). The six currencies included in the...
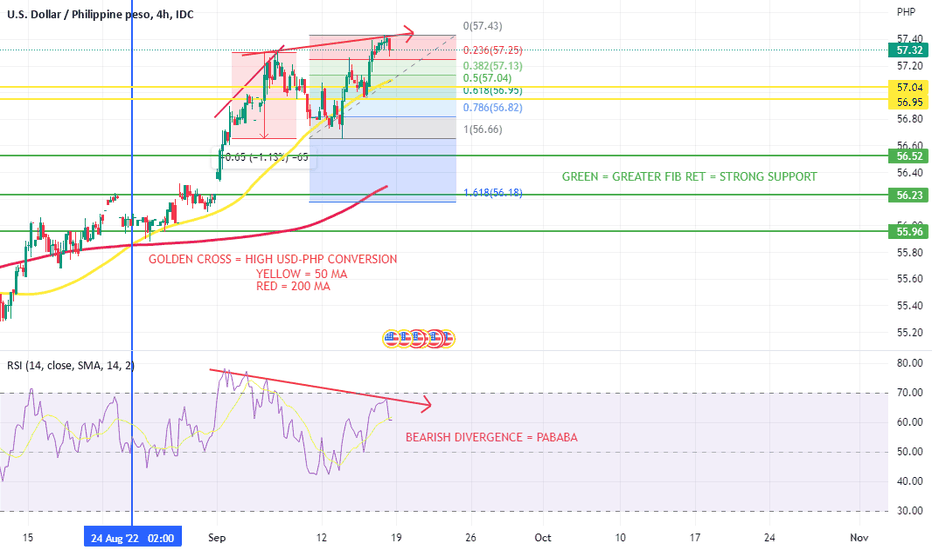
A bearish divergence is a pattern that occurs when the price reaches higher highs, while the technical indicator makes lower highs. Although there is a bullish attitude on the market, the discrepancy means that the momentum is slowing. Therefore it is likely that there will be a rapid decline in price (google copy paste).
USD - PHP CHART DECREASING RSI + INCREASING PRICE = BEARISH DIVERGENCE A bearish divergence is a pattern that occurs when the price reaches higher highs, while the technical indicator makes lower highs. Although there is a bullish attitude on the market, the discrepancy means that the momentum is slowing. Therefore it is likely that there will be a rapid...


