learningedge
PremiumLet’s break down why this setup may present an attractive intraday or short-term play, and map out the critical triggers, levels, and risk points for traders: ▶️ Technical Story at a Glance: FARTUSDT has rallied hard off the prior demand/POI zones, climbing steadily in a rising channel on the 15-minute chart. The move has brought price directly into a...
Ethereum (ETHUSD) is setting up for a major directional move on the weekly chart, and all eyes are on the key breakout zone above $2,800. Let’s walk through the analysis behind this swing trade idea and map out the key risk and reward levels: ▶️ Technical Story at a Glance: After months of downside, ETH has rebounded sharply off the $1,600 zone (clear weekly...
Solana is currently confirming a bullish breakout on the 15-minute timeframe. Price action has decisively moved above the key resistance level at approximately $175.56, supported by strong volume and bullish momentum indicators. Technical Context: The breakout aligns with a broader macro rotation into altcoins, as indicated by declining Bitcoin dominance and a...
CRYPTOCAP:BTC - Bitcoin remains bullish across swing and long-term horizons, supported by strong institutional inflows, favorable macro tailwinds, and robust technical momentum. Short-term signals show mixed sentiment due to overbought conditions and minor bearish patterns. 🎯 Short-Term Tactics (Intraday: minutes–hours) My bias is neutral to slightly bearish....
1/ Short-Term (Intraday): Chop City BTC is stuck in a tight range between 95K (demand) and 98K (supply). Oscillators mixed, momentum fading near resistance. Play: Fade extremes, scalp carefully. Watch: Breakout above 98K or breakdown below 95K for momentum triggers. 2/ Swing Traders (Days–Weeks): Cautiously Bullish Weekly bullish structure intact, but daily...
Trade Bias Verification: Long (with caution for short-term bearish momentum) Confidence Score: 6.5 out of 10 (slightly reduced due to bearish MACD crossover and RSI divergence) Hypothesis Refinement: The bullish continuation hypothesis still holds, but the MACD bearish crossover and RSI divergence on the 1-hour chart signal a stronger short-term pullback or...
Bitcoin’s short- to medium-term outlook is cautiously constructive but nuanced by mixed signals across on-chain fundamentals, technicals, and market flows. On-Chain Fundamentals: Network security remains robust with rising hash-rate and difficulty, supporting long-term confidence. Active addresses and transaction volumes are stable, indicating steady user...
Hello Traders! Today, I'm sharing a detailed technical analysis of BTCUSDT on the weekly timeframe, highlighting key insights from two powerful indicators: Micro Dots with VMA Line and the Wyckoff Phase Oscillator. Why These Indicators? Micro Dots with VMA Line: This indicator provides clear signals (strength and weakness dots) and dynamic trend lines,...
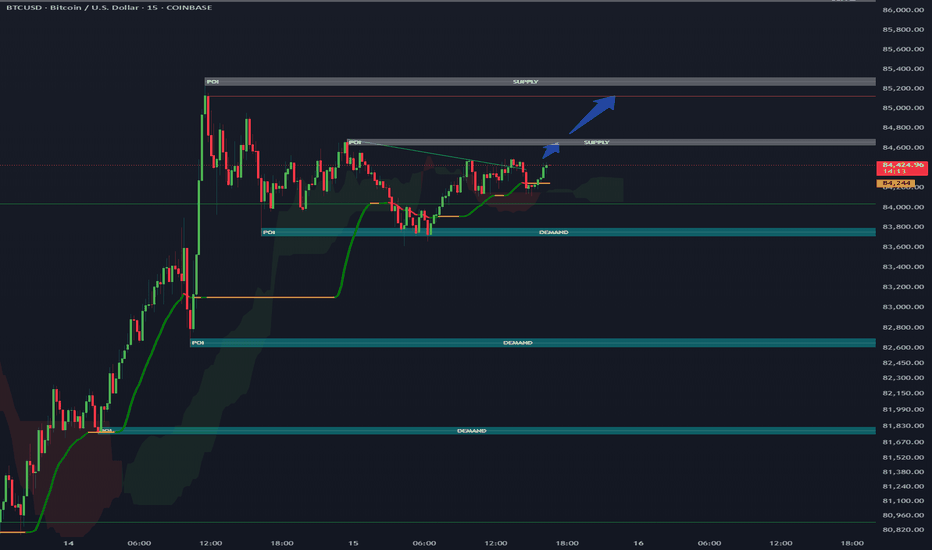
Hypothesis: Long if price closes above 84,500. Entry Criteria: Entry Price: Above 84,500 (15m close). Confirmation: Increase in volume on break. Stop-Loss: 84,000 (below nearest support level). Take-Profit: 85,300 (next resistance level). Position Sizing: Risk 1-2% of capital. Execution Steps: Set alerts for 84,500. Monitor volume for spikes during the...
Here are some targets I will be monitoring for BTC in this bull run - not financial advice. DYOR.
This analysis focuses on Ethereum (ETH) forming a three-year cup and handle pattern, a classic bullish continuation setup that suggests a potential price surge if the price maintains key support levels. The cup and handle pattern is well-known for its predictive strength in technical analysis, where the cup represents a period of consolidation and accumulation,...
Overview: In this analysis of BTCUSD on the 4-hour chart, we are observing a potential breakout from a bullish flag pattern. However, the breakout is not yet confirmed, as the current 4-hour candle has not closed above the flag’s resistance. We will need to see a close above this resistance line, along with other confirmations, to validate the bullish scenario. ...
The 1-hour Bitcoin chart has just printed a climax oversold alert (see blue ball), indicating a potential upcoming reversal. This signal often marks areas where selling momentum is peaking, suggesting a possible shift in market direction. The current setup shows: Traders should watch for confirmation in the next few candles to validate this signal by looking...
Hypothesis: The falling wedge pattern observed on the 15-minute BTC chart is a bullish reversal signal, indicating that the current downward trend is likely to reverse to the upside. This pattern is characterized by two converging trendlines, with the price making lower highs and lower lows, but the slope of the lower trendline is steeper than the upper...
A potential inverse head and shoulders pattern may play out on the OP/USD trading pair, here's a general outline of how one might approach trading this pattern: // Possible Entry Point: A common entry point for an inverse head and shoulders pattern is a break and close above the neckline following the right shoulder. Traders may wait for a confirmed breakout on...
Analysis: //Entry: Breakout Play: If SOL/USD breaks out from the downward channel convincingly with increased volume and closes above it, one could enter a long position. The breakout could invalidate the bearish H&S pattern and signal a potential trend reversal. H&S Pattern Play: If the price fails to break out and instead respects the upper boundary of the...
After a sharp downturn, BTC/USD is now consolidating around $43,000. A breakout from this zone could set the stage for the next move. Keep an eye on volume for direction clues. Set stops beneath the consolidation low to manage risk.
Here is a 4-hour chart of Ethereum, and the identified pattern of a double top with a projected target, here is how one might describe a possible entry, exit, and invalidation criteria for this illustration: Entry: A potential entry could be considered on a retest of the neckline of the double top pattern. This often occurs after the price breaks below the...


