letsipatrader
As discussed from pervious publication on Sunday, I stated that i will be looking to short us 30. with the drop of 500 points this week we certainly in a sellers market, am looking at 3400 as a key support level test the trend line.
I did analysis on this last week but didn’t post it, we currently trading in a channel h4, and daily, price gave a trend line test which am hoping is a liquidity grap confirming a possible move to the upside with a possible 1499-1500 dynamic structure test also imbalance fill, the question is will price break above 15100 to target 15500? or are we going to reject...
Bitcoin is making big moves lately. Haven't really looked at it for a while but if your a technical structural trader, it will only take you one glance to see what may be happening ... A few key moves which I need confirmation to fully trigger by buying bias 1.a test and failure to break . below 28000( should we drop) 2.a break above 3200 and a retest for a...
We just game for testing yearly highs(indicated by weekly resistance) and reacted immediately, currently we forming a wedge trading in an uptrend, looking for a break of structure and possible retests of 34500 and 3400( trendline test)
We currently in channel on the big time frames daily and weekly. Key levels are 143 and 127 for the short target as 127 gave us the break for the bull run, should we break the channel we most likely going to target that support at 127 . Looking at a long term sell on this pair, will update later on in the week.
NFP done and dusted, I personally didn't trade last week, am trying to make it a norm not to trade during NFP week. Its just best for my psychology, kudos to those who made cash last week though. Its a new week and new trading month lets see what we can catch this month. Okay looking at the DIXI, am seeing to key zones, My supply which is around about 108-109...
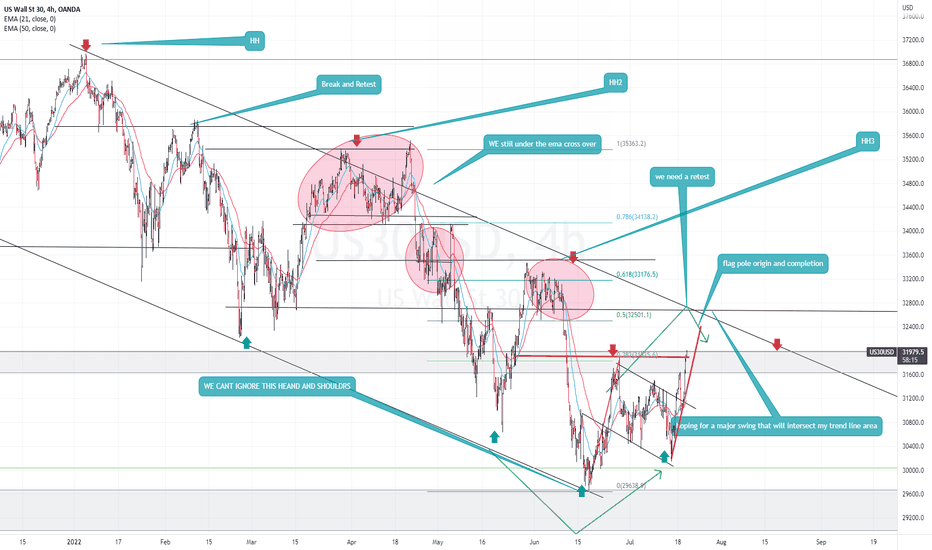
What an explosive two days hey..... Personally i think we still have from Bullish Runs... We need a clear break and Retst of this channel taking out one of the HH....The current bullish run could be due to anticipated earnings coming up this week. I gave detailed descriptions on the analysis hope it makes sence
Morning Peps. USDJPY---- We need a change in character to confirm our sell bais, which should be indicated by a new low, am hoping around about that 31.8 zone. If we selling i am targeting that cross over zone
Personally, I am seeing a am major range on Gold with a major low area and a major hh as well, we currently testing the demand zone that gave us the rally to that major hh area. I gave two detailed descriptions of what's happening in the range. Personally we still quite bearish, I want to see a close above at least 1754-1755 to confirm my buy bias. We are bound to...
USDJPY has been on a massive bullish run the past couple of weeks and even made new year highs as price moved above our trendline. We now have a change in character attributed buy a trendline break and price failed to make a new HH . I make out my zones of interest for shorting opportunities
We currently testing support turned residence(dynamic structure), Fundamentally due to world economic recoveries oil demand should rise. My thinking is a pull back before we shoot up. Interest rates went up on Friday which swill increase the value of the dollar intern making oil more expensive . Fundamentals to look out for are Russia and Ukraine possible war.
GBPUSD seems quite bullish, we just had a pullback to form a new demand, Which is indicated by the price rejection between our two emas(21 and 50). Looking to enter buys between the ema intersection as we break through supply zones.
This one I will wait it our planning for have a heavy long at my buy zone. My first buy zone has a a demand zone which has a break in structure indicated by the bullish engulfing pattern which we most likely gonna find buyers waiting in that area. Buy zone two is new structure formation
Currently we trading in a channel we price fails to break on either side of the channel. Gonna long for now us the trendline as support. You have 3 potential tp zones marked by the red zones as thats were we mostly gonna find supply zones
We currently in a range. When u dice deeper am seeing a Harmonic Pattern Butter with pint D meeting being an overbought zone. We on a bullish run heading to the biggest spending months of the year. Question is will we pull back and go higher.
Lets see how this plays out......... not really trading this at the moment but hers my 2 cents
Ok here am bullish personally. Am seeing out two possible scenarios playing out here. One the possible head and shoulders highlighted in yellow. We have a series of impulses and correction. Which we are currently in a correction phase plus a new demand zone. Am hoping the market open bullish to go test the zone which gave us that rejection wick. Second scenario...
This is an update from yesterdays analysis. I must say got stop bout a couple of times due to entering buys early. So price eventually reached our by zone and tapped deeper into it, Was not expecting that but one has to respect price lol, Eventually took a buy which broke through structure. I am hoping that price comes back to re test that structure break. I dont...


