liambillo35
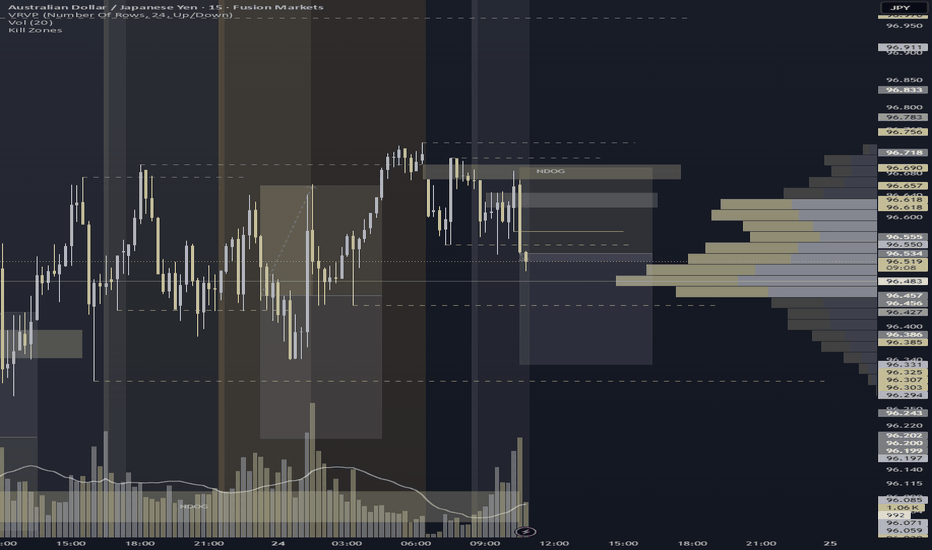
EssentialShorted after clean reaction from NDOG (96.669–96.697) and rejection at my 96.617–96.645 resistance zone. Entered on a strong bearish shift candle with solid volume. TP locked at 96.331, past the 96.439 sellside draw, aiming toward structural liquidity near 96.301. Playbook reminder: structure validated, entry timing needs refinement—early trigger noted. SL hit...
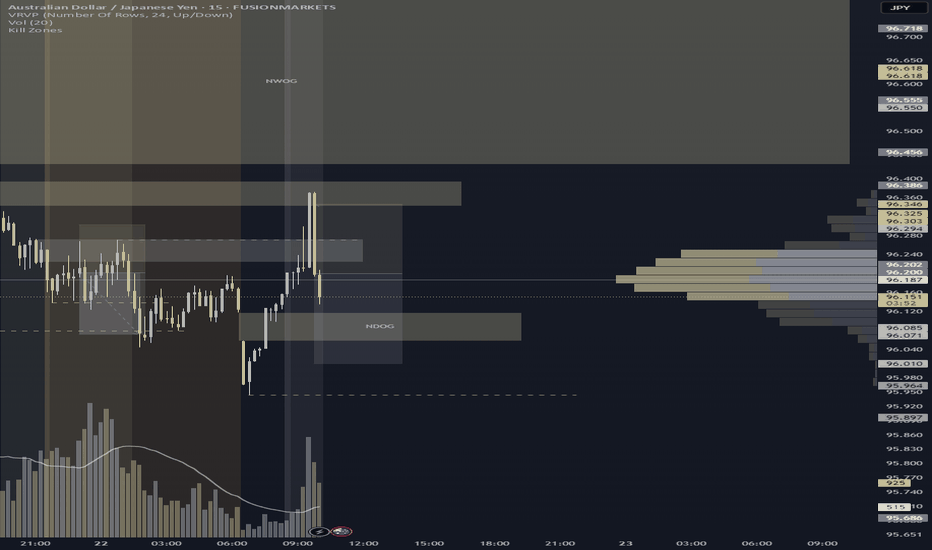
Identified a key resistance zone at 96.224–96.273, with price showing rejection and wicking behavior after sweeping buyside liquidity at 96.271. Entered short following a decisive reaction candle. Trade is structured with stop loss above the swing at 96.303 and TP set at 96.010, targeting a clean overshoot of today’s NDOG (95.944). 🔹 Setup: Resistance rejection...
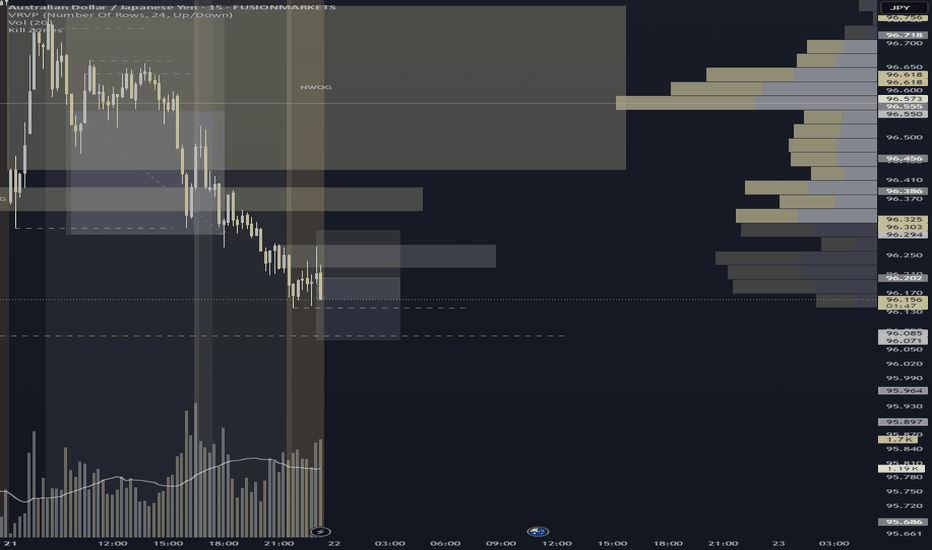
Executed a disciplined short off the 96.224–96.273 resistance zone, which aligned with bearish structure and rejection candle confirmation. Entry followed lower high formation, with stops placed above the recent swing at 96.303 to allow for volatility breathing room. Target set at 96.079, aligning with a clean sellside draw. Price showed momentum alignment and...
Box framed between 95.961–94.719, with layered buyside liquidity swept at 95.859 and 95.961. Price printed a bearish body below structural shift (-CISD), confirming trap activation. Entry executed post-shift → targeting sellside liquidity at 95.521, with extended draw potential toward 94.719. Liquidation heatmap shows dim clusters above, bright gold clusters...
Entered a long position after identifying an short formed W formation within discount territory, mapped from yesterday’s high–low range. Price action showed clear structural symmetry, with the second leg completing at a key demand zone. 📌 Buyside liquidity at 22,692.27 acted as the inducement level—price swept it and respected the zone, signaling smart money...
Price formed an extended M pattern in premium territory, sweeping buyside liquidity at 197.473. A clean structural break followed the second peak, confirming bearish intent and shifting narrative downward. Entry was taken post-break, with a protective alert set at 197.613 to manage invalidation risk. Targeting 196.744—the upper third of the discount zone—this...
Price swept major sellside liquidity at 196.786, forming the deepest leg of a broader structural draw during London session. Entry followed a clean W pattern formation and bullish reaction from deep discount territory. This setup aligned with structure, liquidity engineering, and session timing. Trade captured a reversal opportunity with price lifting from the...
Price swept key sellside liquidity at 94.227 and held support just above 94.147. A clean W pattern has now formed with a decisive bullish body close above the shift zone, confirming bullish intent. Entered long with a take profit set at the box equilibrium level of 94.497 and stop loss placed below structure at 94.121. Trade aligns with structure, liquidity...
Price swept key sellside liquidity at 197.489, forming a clean external W pattern in deep discount territory. A bullish engulfing candle followed, closing above the internal shift point and reclaiming structure just beneath 198.012 (yesterday’s low). Entered long on confirmed shift with TP set at box equilibrium (EQ) and stop loss placed below the pattern base....
Buyside liquidity swept at 22,554.05 after fresh ATHs. Short triggered on a strong bearish news candle from premium territory. TP set at 22,423.99 near a Bright Gold HeatMap cluster. SL at 22,585.01 above structural highs. Trade thesis driven by Box Theory, liquidity targeting, and expected short-term correction from overextended highs.
Price swept buyside liquidity at 94.753, forming the second leg of an extended M pattern within the premium zone of the defined box. A clean bearish shift followed, confirmed with a strong-bodied close and short upper wick. Entry was executed post-shift, with confluence from Bright Gold liquidity clusters identified in discount using the HeatMap. TP set at the...
Price swept buyside liquidity at 198.034, completing the second leg of an extended M pattern. A strong bearish candle confirmed a break of structure beneath the key shift line, validating short intent. Now watching for downside continuation toward 197.214 (TP level), with alerts set at 198.138 for any potential invalidation. Thesis: - Extended M structure...
Tracked this trade live as price swept buyside liquidity at 22,300.59, forming a potential short-formed M pattern. Watched for confirmation and waited patiently through a small bullish pullback, identifying potential trap behavior rather than true continuation. Once a bearish market structure shift (MSS) occurred—confirmed by a body close below the prior wick...
Price Respecting Downtrend line. Expect to go short on 5 minute timeframe with a short term uptrend on lower timeframe WILL POST LOWER TIMEFRAME ENTRY BELOW!
Kiwi/US Dollar trending up nicely during UK session. Flat top bottom pattern breaking the up trend below. Expecting this market to rally down after a nice M pattern forming. Will wait until price breaks character then enter pending order on red FVG for a 1:1
Waited for price to retrace back into the last hour of asian session range and waited for price to close back outside. Took a sell position and targeting a 1:5. I tend to go with a slighly bigger RR (Risk Reward Ratio) because the trend is in continuation to the downside When I am fading the breakout depending on price action. I go for a 1:1 RR
Waited for market to break below, even if it was a wick and not a full body and then waited for a pullback into the Asian Session Zone and waited for a red candle to close outside of the range. Took a sell position for a 1 RR
The market broke through the asian session high, once I waited for retest back into the range, I waited once more for the market to pullback. Entering this trade for a buy identifying all of the buyers momentum to the upside. Took my profits at 1:1 RR


