📉EURAUD is trading in a strong downward trend on a daily chart. Following a pullback yesterday due to an economic event, the price hit a significant horizontal resistance level. After testing this resistance, the pair is showing clear bearish signals. On the 4-hour chart, there is strong confirmation of bearish momentum, indicated by a bearish imbalance and a...
CARDANO formed a significant inverted head and shoulders pattern on the daily chart. A bullish breakout above the neckline indicate strong upward momentum. I anticipate further growth, with a target of reaching the 0.84 level soon, followed by 0.90.
GOLD has breached and closed below a significant daily horizontal support level. Prior to this violation the support level, the price was consolidating in a tight horizontal range. The bearish breakout from this trading range is a strong indicator of further declines. The pair could continue to drop after retesting the broken structure to 3122 level.
EURAUD broke and closed below a key daily support level. Which has now transformed into a robust resistance level. I anticipate further downward movement. The next support level is at 1.706.
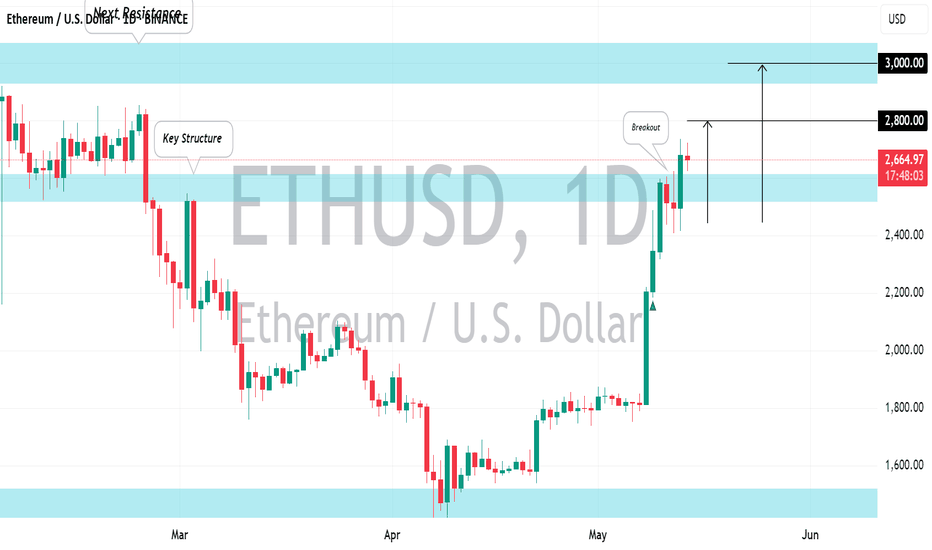
Ethereum has successfully violated and closed above a significant daily horizontal resistance level. The bullish momentum appears to be ongoing, and the price is likely to soon test the psychological level of $3000 mark. Following this test, a breakout is expected, potentially driving prices to new heights.
⚠️EURCAD is currently testing a recently violated horizontal support level within a trading range. It is highly likely that this broken structure has now become resistance. We will look for a confirmation to sell upon a bearish breakout of the neckline of a descending triangle pattern on the 1-hour timeframe. A close of the hourly candle below 1.5545 will...
Following a bearish movement yesterday, gold has fallen to a significant intraday/daily horizontal support level. The formation of a cup and handle pattern serves as a strong buy signal, and there is a high likelihood that the price will soon retrace to 3275 level soon.
📈NZDCHF appears to be a promising trade, out of the different gap openings we see today. The price has reached a significant intraday resistance level. I believe that the gap will likely be filled soon, as I am already observing signs of selling pressure on the hourly chart, including the formation of a double top pattern. It is possible to anticipate a...
The EURUSD chart shows a large head and shoulders pattern on a daily basis, indicating a strong bearish reversal signal with the breakout of the neckline. The broken neckline now acts as a key resistance level, suggesting a potential further decline towards the 1.1150 level.
Ethereum is showing signs of recovery following a prolonged period of bearish movement. A bullish breakout of a significant daily resistance level indicates strong buying activity. I anticipate further market recovery with a potential target of reaching the 2,500 level in the near future.
The Dollar Index formed a significant inverted head and shoulders pattern on a 4-hour chart. Following the release of yesterday's economic data, the market surged and broke through both the neckline and a strong downward trend line. This created an expanding demand zone with two broken structures. I plan to take long positions in anticipation of a bullish...
I spotted a nice bearish pattern on Dollar Index chart on a daily timeframe. The price formed a bearish flag pattern. Trading in a bearish trend, the violation of a support of the flag is a strong trend-following signal. We can expect a movement down to 98.95
Gold broke through a daily significant horizontal resistance level yesterday and closed above it. It appears that the bullish trend is likely to continue, with the price expected to retest its all-time high soon. After reaching this level, be prepared for a potential breakout that could drive prices even higher.
📈GBPUSD experienced a significant surge yesterday and today we are witnessing a retest of a previously broken resistance level in a horizontal range, which has now turned into support following a breakout. Ahead of the FED Rate Decision today, there is a potential buying opportunity for GBPUSD: I spotted a falling wedge pattern on the 4-hour time frame. A...
AUDCAD was consolidating in a sideways pattern for over two weeks on the daily chart. It broke through its resistance with a strong bullish move yesterday, suggesting potential for further growth. The next resistance level is at 0.900.
I see a nice gap down on USOIL, with a strong possibility that the gap will be filled soon. The price approached an important support level and showed signs of a potential bullish signal. I also observed a breakout of the neckline of an ascending triangle pattern on the hourly chart. It is likely that USOIL will continue to rise and reach the 57.7 level in the...
GBPAUD formed a significant bearish reversal pattern on a daily chart, with the price breaking below a key support level and indicating a Change of Character. I anticipate that the pair will continue to move lower, potentially reaching a support level of 2.034 soon.
The USDJPY chart formed an inverted cup & handle pattern that has broken its neckline on a daily timeframe, signaling a confirmed Change of Character (CHoCH) and suggesting a potential bullish reversal. This could lead to a market recovery and a possible move towards the 146.00 level in the near future.


