mahmoudhefny89
PlusRZLT has successfully breakthrough a significant resistance level which serves as the resistance of "cup & handle pattern" and EMA200 which allows the stock to target the below price ranges: - Potential buy range: 6.15 - 6.30 - TP1: 9.4 - TP2: 11.1 - SL: 5.95 "require confirmation"
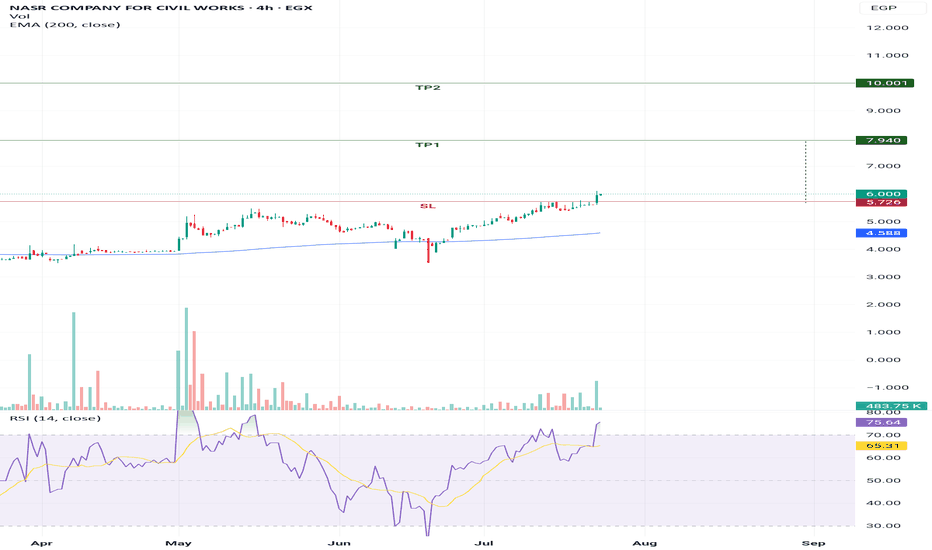
NCCW successfully breakthrough significant resistance level which also considered the resistance level of "cup and handle pattern" targeting the below targets: - Potential buy range: 5.7 - 5.9 - TP1: 7.9 - TP2: 10 - SL: below 5.6 " require confirmation" It is considered medium to long term target.
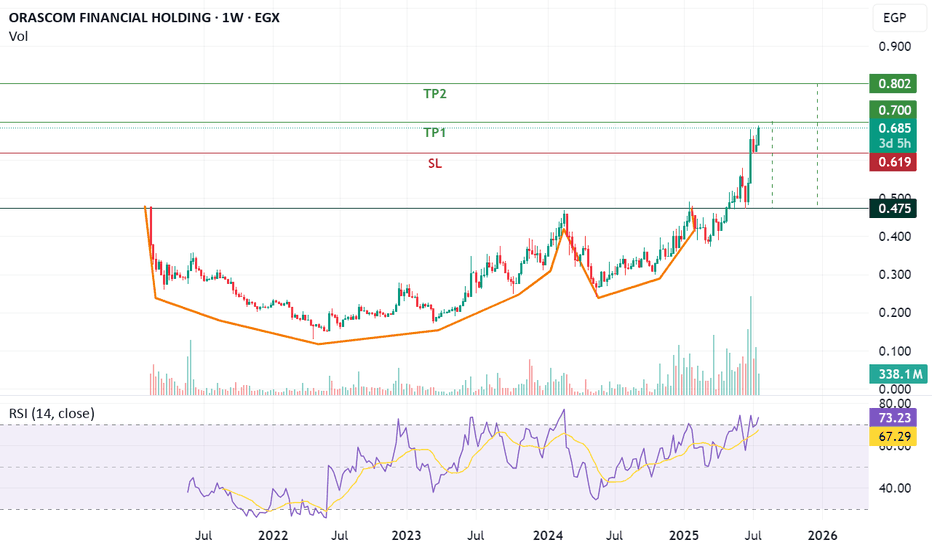
OFH has breakthrough a significant resistance line which represents the neck of the pattern "Cup & Handle" leading the stock to achieve the below targets on the medium to long term. - Potential buy range: 0.64 - 0.66 - TP1: 0.7 - TP2: 0.8 - SL: below 0.62
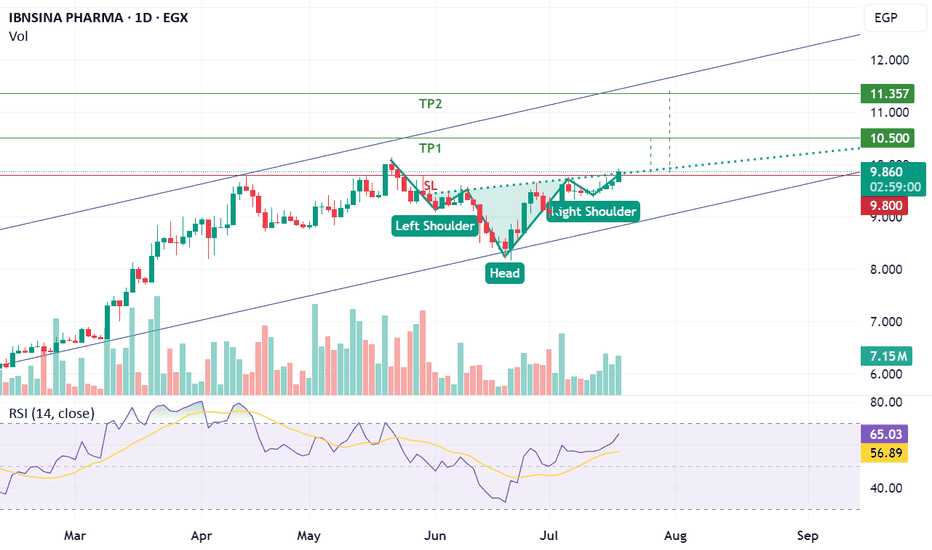
ISPH just breakthrough a significant resistance line which is considered inverted head and shoulders resistance line, if the price closed higher than 9.8 this will result in achieving the below targets. - Potential buy range: 9.75 - 9.83 - TP1: 10.5 - TP2: 11.3 - SL: below 9.7 "require confirmation"
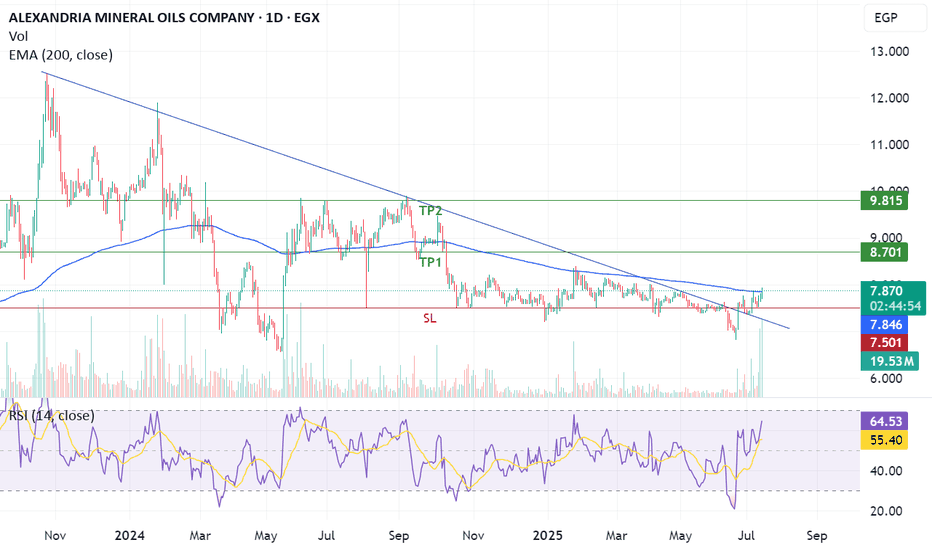
AMOC has successfully penetrated significant downtrend resistance line and EMA200 supported by volume exceeding average 30 days vol, targeting the bellow level: - Potential buy range: 7.8 - 7.9 - TP1: 8.7 - TP2: 9.8 - SL: below 7.5
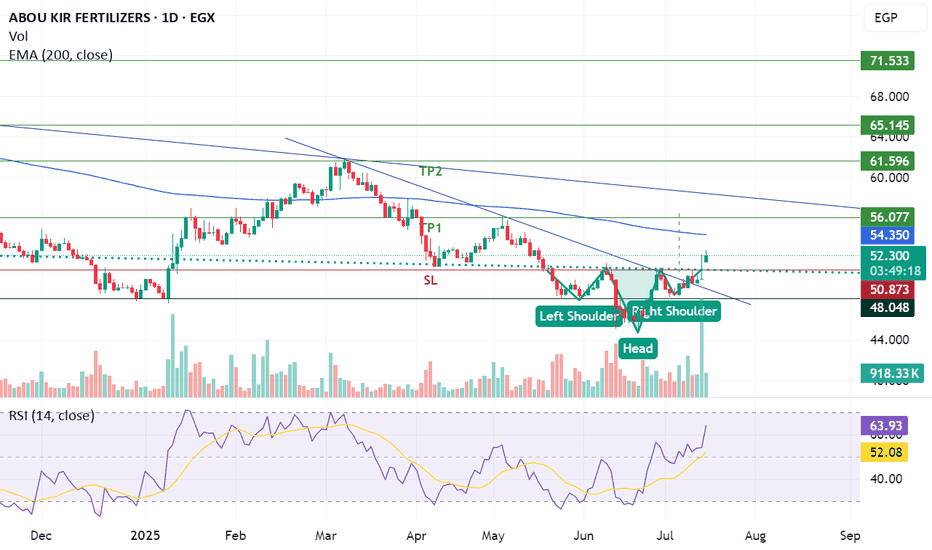
ABUK has successfully breakthrough inverted head and shoulders pattern and downtrend resistance line supported with volume exceeding average 30 days allowing the stock to achieve the below targets: - Potential buy range: 51 - 51.5 - TP1: 56 - TP2: 61.5 - SL: below 50.70 "Require confirmation"
TAQA has been moving in sideways price channel ranged from 11.60 to 12.90 in the past 7 month, and successfully breakthrough the significant upper resistance line of the sideways channel supported with trading volume higher than the past 10 month potentially targeting the below: - TP1: 14.3 - TP2: 15.4 - TP3: 16.5 - SL: Below 12.9 "Confirmation required"
Gold has broke down the uptrend and heading towards the below support levels: - 3,160 as 1st support level and 38% Fibo retracement level. - 3,050 as 2nd support level and 50% Fibo retracement level. - 2,950 as 3rd and most powerful support level since it is supported by EMA200, major support uptrend line, and 61% Fibo retracement level. My advice is "No long...
CCAP has been moving in an upside wedge since May 2024 and faced a downtrend resistance line which it succeeded to breakthrough today with a volume exceeding the past 12 month. - Potential buy range: 2.97:3.05 - TP1: 3.2 - TP2: 3.5 - SL: 2.97 "confirmation required"
The stock has been moving sideways since March 2024, and today succeeded to breakthrough a simitric triangle pattern with volume exceeding the past 6 month. - Potential buy range: 8:8.4 - TP1: 9.1 - TP2: 11 - TP3: 12.2 - SL: Below 7.9
The stock has been moving in sideways since March 2024, and formed a simitric triangle pattern which succeeded to breakthrough today with volume exceeding past 6 month. - Potential buy range: 8 : 8.30 - TP1: 9.1 - TP2: 11 - TP3: 12.2 - SL: 7.9
ACTF just breakthrough a horizontal resistance level and a declining resistance line which supports an uptrend targeting 3.6 as a 1st target and 4 as a 2nd target.
There are 2 technical patterns supporting the uptrend of the stock: 1. Break through downtrend. 2. Currently forming Inverted head and shoulders In case the stock brokethrough "inverted head and shoulders neck" at 28 it will achieve 1st target 30.9 and second 32.

