mudusir
Technical Analysis (Weekly Timeframe) #Ethereum (ETH) is currently forming a strong bullish structure – the classic Inverse Head & Shoulders pattern – on the weekly chart. ✅ Left Shoulder ✅ Head 🟡 Now Printing the Right Shoulder... This is a long-term spot trade setup, not for futures. 📈 Key Buy Zones: 1️⃣ First Buy: $3,346 2️⃣ Second Buy: $3,072 3️⃣ Final...
#ZEN is currently consolidating in a symmetrical triangle pattern on the 4-hour timeframe, following a strong bearish move. The price action has shifted to a sideways range, signaling a potential trend reversal or continuation setup in the making. What to Watch: We’re closely monitoring a bullish breakout from the triangle or resistance zone. A confirmed...
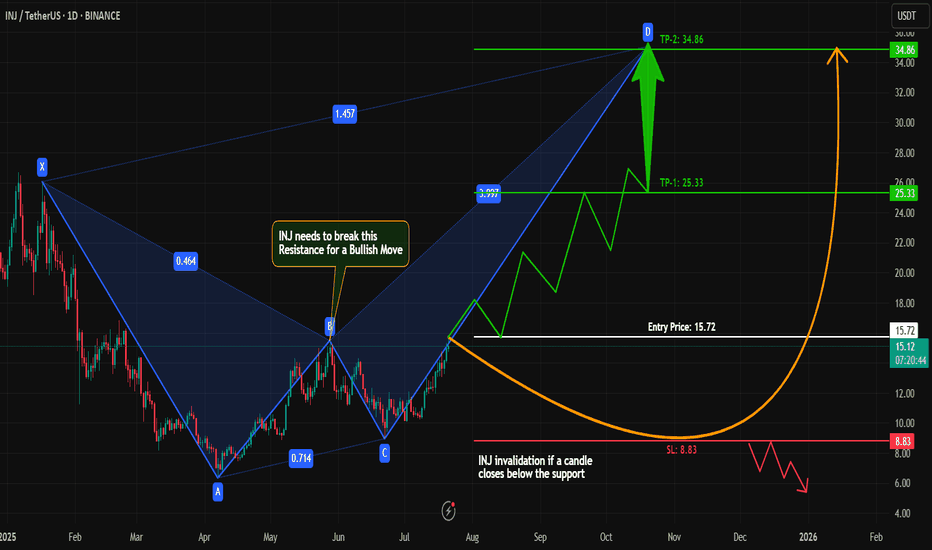
Hey traders! 👋 #INJ is forming a classic bullish harmonic pattern on the 1D timeframe, and what’s exciting is — no bearish divergence or rejection signals yet! 🔍 Key Technical: Currently respecting the harmonic structure perfectly B Point at $16 is acting as a major resistance No bearish signs = bullish bias stays valid 💡 Trade Idea: We’re watching closely...
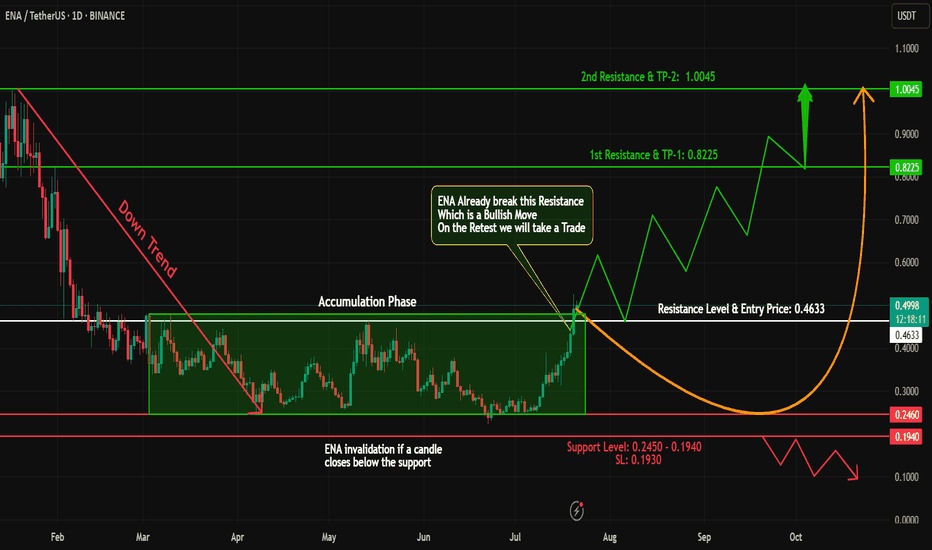
#ENA has shown a classic accumulation + breakout structure! 🔹 Phase 1: Downtrend – From 1.00 to 0.25, #ENA went through a steep correction. 🔹 Phase 2: Accumulation – Price consolidated for a while, forming a strong base. 🔹 Phase 3: Breakout – #ENA has now closed a daily candle above the accumulation zone – a strong bullish signal! 📊 Trade Plan: ✅ Long Entry: At...
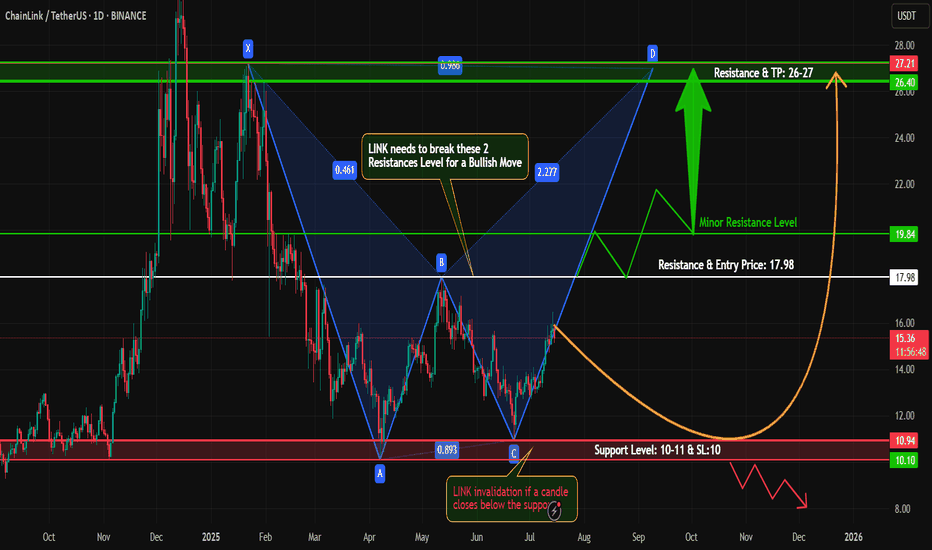
Hey Traders! #LINK is currently trading near the bottom and forming a potential harmonic pattern, suggesting a possible move towards the D-point completion. Technical Outlook: Price action is respecting the harmonic structure. We're watching closely for a break above key minor and major resistance levels. A successful breakout and retest could confirm a...
#BONK is flashing strong bullish signals on the 1D timeframe: Double Bottom Pattern – A textbook reversal signal Break & Retest of Key Resistance – Now acting as solid support Price at CMP (Current Market Price) – In the ideal buy zone This confluence of signals suggests momentum is shifting in favor of the bulls. If volume kicks in, we could see a sharp...
Hey Traders! 👋 I’ve built a multi-phase #Bitcoin trading strategy based on historical highs/lows and key confluence levels (trend + Fibonacci). If you're looking to ride #BTC’s volatility with clear direction and logic — this plan is for you! 💡 No overtrading. No leverage needed. Just strategic entries and patience. 👇 Check out the roadmap: ✅ 1st Move: Long...
#Ethereum (ETH) is showing strong bullish momentum on the 4H timeframe and is currently developing a classic AB=CD harmonic pattern, which often precedes a continuation of trend. ✅ Key Observations: #ETH is holding within a solid uptrend structure No signs of bearish divergence or reversal patterns yet Momentum remains healthy, with buyers in control 🔍 What...
Hey traders! 👋 #JASMY is currently consolidating sideways on the 4H timeframe, right after completing a harmonic pattern – a strong technical signal often followed by a trend reversal or continuation. 🔍 What I’m Watching: ✅ Harmonic Pattern Completed: The recent price structure aligns well with a bullish harmonic setup. 🔄 Sideways Movement: Market is in...
📉 #Bitcoin has recently broken its key trendline after making a new All-Time High (ATH). This could be the first major sign of a trend reversal. Here’s what we’re seeing: 🔹 Trendline Broken: The uptrend has been broken — a significant technical signal. 🔹 Retesting the Break: Price is currently retesting the broken trendline, a classic move before continuation. 🔹...
Hey traders! 👋 #CAKE is currently consolidating within a symmetrical triangle – a classic setup that often precedes a big move! The price action is tightening, and momentum is building. 📈 🔍 What We're Watching: Pattern: Symmetrical Triangle Bias: Bullish, with potential for upside breakout Key Resistance: 2.65 Entry Plan: We'll wait for a confirmed breakout...
🟡 Harmonic Pattern + Support Break = Bearish Confirmation 🐻 📉 #XAU/USD Analysis | 4H Timeframe #Gold has temporarily shifted into a bearish trend, and here's why I'm eyeing a short setup at current levels: ✅ Harmonic Pattern Completion spotted on the 4H chart ✅ Clear break below key support zone, now acting as resistance ✅ Lower highs and lower lows forming –...
Hey traders! I'm spotting a potential bullish setup on #PEPEUSDT — and it’s one worth watching closely. 🔍 Technical Overview: On the 1D time frame, #PEPE is forming a textbook harmonic pattern — still confirming. No bearish divergence or reversal signs spotted so far — momentum remains intact. Key level to watch: B point of the harmonic pattern, acting as...
Current Market Structure: #RUNE has been in an accumulation phase after a prolonged bearish trend. The price is consolidating, forming a potential Wyckoff Accumulation pattern. No further bearish signs are present except for the previous break of a strong support level. Key Levels to Watch: 🔹 Support: $0.788 (previous level) 🔹 Resistance: $2.5 (breakout zone) 🔹...
Market Insight: #BNB is currently trading in a prime buying zone for spot traders, showing strong price action on the 4-hour timeframe. A Head and Shoulders (H&S) pattern is forming, and we are closely monitoring its breakout for a potential bullish move. 🔹 Bearish Signs? None so far! The market structure remains intact, and buyers seem to be in control. Trade...
Hey traders! #SOLANA is currently consolidating sideways and printing a bullish flag pattern on the 4-hour timeframe – a classic continuation signal after a strong upward move! 🚀 Here's the plan: Wait for a clean breakout above the flag's resistance Enter on the retest of the breakout level to confirm support Apply strict risk management and target the next...
Price Action Alert on #BTC/USDT (4H Timeframe) #Bitcoin recently broke down from a rising wedge, a classically bearish pattern. Alongside this, we've also identified a bearish RSI divergence, further validating potential downside momentum. Key Observations: 🔺 Rising wedge breakdown confirmed 📉 Bearish divergence on RSI (4H) 🔁 Price is now retesting the...
Hey traders! #MAGIC has shown strong volume over the past few days, and now it's consolidating sideways – hovering just above a key support zone. This kind of setup often signals that a bigger move is brewing... but which way? Here’s what we’re watching: ✅ Support holding firm – buyers seem to be stepping in around this level. ✅ Volume remains healthy,...


