Talk about sensitivity to interest rates. Long duration equities or short duration? Value or Growth? In this type of environment, at times it can feel as if interest rate movement is the end all be all. To be honest, if you think that, I don't believe you're necessarily wrong. Sensitivity to changes in the yields is driving the displayed relationship. For now...
Handful of ratios used to gauge the direction of yields. Copper vs. Gold appears to be the outlier when looking at March and May peaks.
Taking a look into the daily and weekly charts of $TAN. Additionally, I discuss a handful of index constituents. **Not Investment Advice**
Trading right alongside the 3-month VPVR Point of control (blue line) i.e. high volume node area, one can assume this a level where we'll see some demand step in.
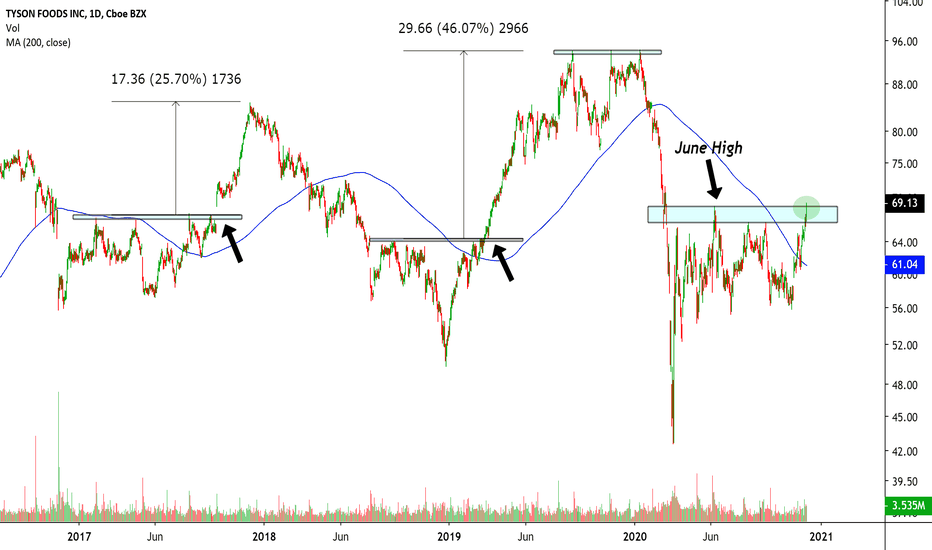
Above the 200 DMA, however the MA remains downward sloping. Low P/E, low growth, consumer staples stock. Risk:Reward is ideal. Substantial upside, FVE given 5yr DCF EBITDA Exit : $88 per share
Try this on for size. 6 . Falling USD pushes interest rates higher (Dec '20 - December '21) Curious to see how this circular relationship plays out!
Rates rates rates. Lower interest rates in the US are a tailwind for US RE and result in US RE outperforming Global Ex-US Real Estate. The US RE vs. Global Ex-US RE ratio is breaking down is priced at January 2020 levels
Gold trading below the 200 DMA is interesting given all the inflation talk. If you have a strong conviction for gold as an asset class over the next 5-10 years, picking up Gold here should be a no brainer.
Semiconductor ETF (SMH Monthly candlestick chart, displaying a large upper shadow for October.
Above 25 tends to lead to increased momentum in the short-term.
Equal weight vs. Cap weight S&P 500 Quality vs. MOMO Smallcaps vs. Tech Value vs. Growth ( S&P 500 ) Topics of conversation all year long...expecting this to continue...
The percentage of Nasdaq 100 stocks trading above their 50 DMA is at 33%.
S&P 500 futures are holding their 50 EMA on a 30min candlestick chart...
With a ~32% weighting in Developed European markets, PZD is set to underperform without the help of the Eurozone.
This chart says a lot about the last 12 months and will hopefully help guide into the next 12!


