strong chance of capitulation to 12k if 15700 is broken - hence best be cautious if BTC approaches the 15700 mark as its a freefall from this level
next support is at the wick at 16378 , then if that fails its down to 15700
Probably a good idea to have a stop at around 16293 as if BTC breaks this area it can capitulate to the 12000 zone.
Cmon guys - No one should have longed this move. This was pointed out on Oct 30th on the chart below that its strong double MA bearish setup and its at resistance also -plus its sitting right below the MA200 ! This has a very high probability that it was going to break down at this location to the 18k area as this action has resulted in the same...
ETH - First support at 1364. if that fails to hold then the next attempt at support is 1264
FTX looks to be a double top with a target of 13.8 followed by 8.0
This must be a Bull Trap as when switched to Line mode the minimum target for the double top drop is 14k and not 18K. As BTC has not even made a candle wick down to 14k I dont think the move down is completed yet. This current move up is probably going to end up being a failed rally and BTC will then move back lower and complete the move to the 14k to 12k ...
This must be an incomplete move up for ETH as the target of the double top drop should be the 720/680 area . However ETH has only dropped to the 800 area this far. My thought is ETH will be coming back down to complete the drop to 680. What if im incorrect ? ========================== If ETH is truly bullish then ETH will push past the resistance at...
on the 8 day candle ( which has just closed ) the Ma20/Ma200 and Ma50/Ma150 are crossing bearishly . When this has occurred in the past it has resulted in a move down and I'm expecting that may play put here also .
BTC - Wyckoff Double top Distribution with Target 10600. Id expect there will a be larger red capitulation candle down with supporting volume before the 10600 area is hit.
This looks suspect to me , because if we apply Wyckoff to the current setup then the FUT ( Failed Up Thrust ) area is a rejection and BTC should make a lower low. Hence id expect BTC to at the minimum touch the area between 17655 to 16168 area. This move down has not occurred yet and I'm expecting it will play out shortly
XRP currently at retest of support now turned resistance for the Descending Triangle . Also at a TD9 at resistance . Target should be the .25 area.
Looks to me like ADA will eventually test the support at .34 and possibly lower and id sprinkle some orders at this area. Meanwhile id be patient and ignore any relief-rally dead-cat bounce bulltraps no matter how good they seem.
XRP strong resistance at .56 and .70 expecting an eventual move back down to retest the .27 and .22 areas.
ETH has moved under the 1418 support which has now turned into resistance. Id expect the next target for this setup will be to test the next support down at 1055 and see if a recovery is possible .
This looks like a "Bump and Run Reversal" setup to me and BTC is most likely eventually going to touch the 10500 area. This is because the target area for a "Bump and Run Reversal" is normally where the "lead-in" ends which is around 10500 on this chart.
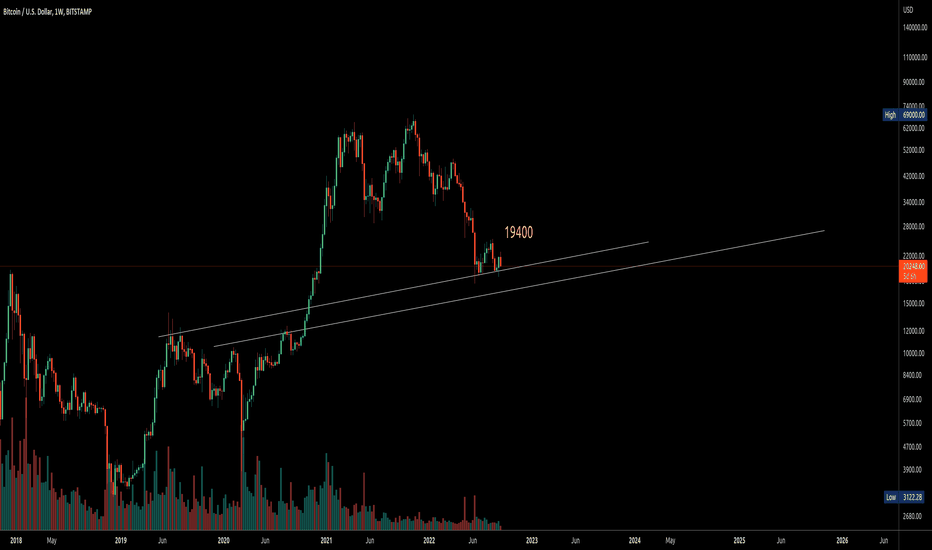
Stay calm and dont panic sell as support is at 19400 and I'd expect a bounce there ..Moving or closing below 19400 could be challenging however as the next target will be in the 16k zone
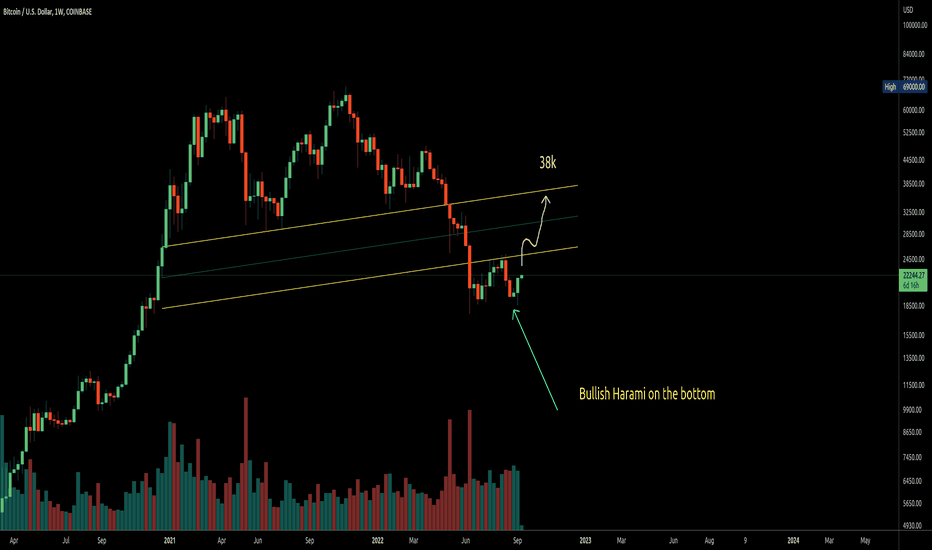
Looks like a Bullish Harami to me on he weekly indicating a possible strong move up to around 36k


