BTC Possible first target at 23600 which is where the EMA100 acts as resistance - Followed by a possible second move to 31628
The parallel channel shown on the graph has been around since Oct 2020. Looking back we can see that the top of the parallel channel has acted as resistance and the bottom has acted as support The TA rules for a parallel channel specify that movement out of the parallel channel is a multiple of the channel width . This part is interesting because...
This looks like a falling wedge to me . ** Confirmation will be if BTC is able to bounce at the support at 18665 ** Note failure to bounce at 18665 will indicate further downside action towards the South pole
On the July 29th graph below it was suggested that BTC will most likely drop lower when the MA50/20 cross on the two weekly chart . This is what we have seen play out currently. This is because when this setup occurred in 2015 and 2019 BTC dropped lower by 29% and 19% respectively (from the location of the crossover). if we take the average of the...
The 2 week graph shows that the MA20 (green line) and the MA50(yellow line) are set to cross in about 3 days at point C, A look back at previous crosses 'A' and 'B ' show that when this MA cross occurred BTC moved down and average of 28% and 20%. Hence my though is that BTC will most likely move back down to the 20k to 19K area and this move up could...
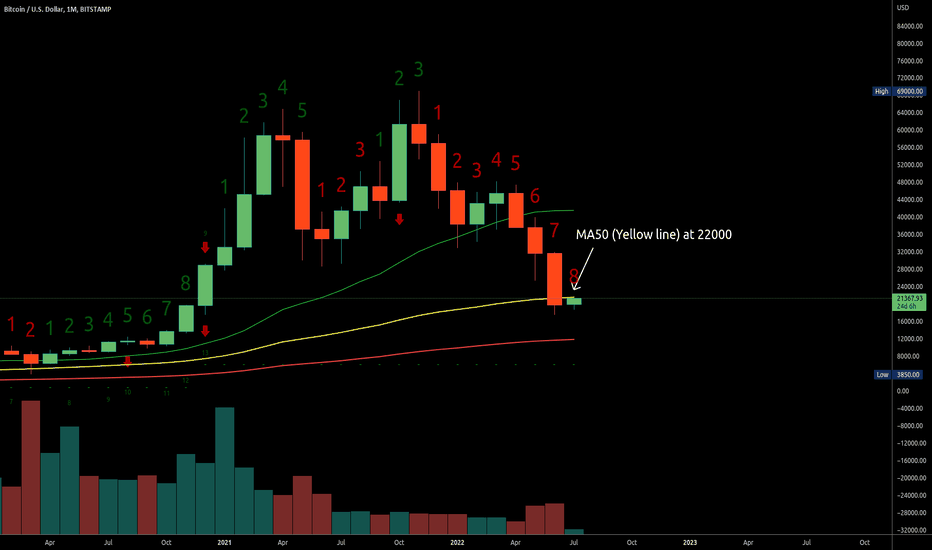
BTC is going to have to prduce one heck of a bullish candle to get past 22000 . Why ? === Because a look at the monthly chart shows that the 50 moving average sits at this 22000 and is going to act as resistance . To clear this resistance BTC is going to produce a large bullish candle and move to around the 24k to 25k level .
Possible head and shoulders shorterm move to 25300 . This setup requires a Daily close above the MA20 (the green line) at 20500 to get the ball rolling . Currently BTC sits just below the MA20 on the daily Chart On the flip side this setup is considered a failure if instead of heading upwards BTC moves below 18500 on the Daily Chart. Such a move will...
Going by the "head and shoulders " and the "Adam and EVE" patterns discussed earlier in the chart below ; Id expect a bounce area to be between 18782 and 17390
The Stochastics hasn't bottomed out yet on BTC Monthly: Why ?: ========= Because when the Stochastic bottoms out we see the green indicator line cross over the red indicator line indicating movement back upwards. An example of this is marked on the Stochastic at Points "A" and "B" The Current stochastic at point "C" shows BTC is only just breaking the...
BTC - Bearish Engulfing close on 4 day candle indicating potential downside move. However the EM300 sits at 19500 and can act as support . if 19500 fails to hold and BTC closes below this level then movement lower to the 17/18k area can be expected
A look at the head and shoulders setup below shows BTC is still at the same spot and has now formed an Adam and EVE. The Adam and EVE setup can play out as a double top so a close below 19789 is concerning as the target will be 18465. So whats the current hold up? ======================== A peek at the weekly chart shows BTC is currently stuck below the...
This looks a bit too much like a bearish head and shoulders for my liking. Especially given the MA200 rejection on the right shoulder (The Blue line) The calculated moved down if this plays out is to approx 18465
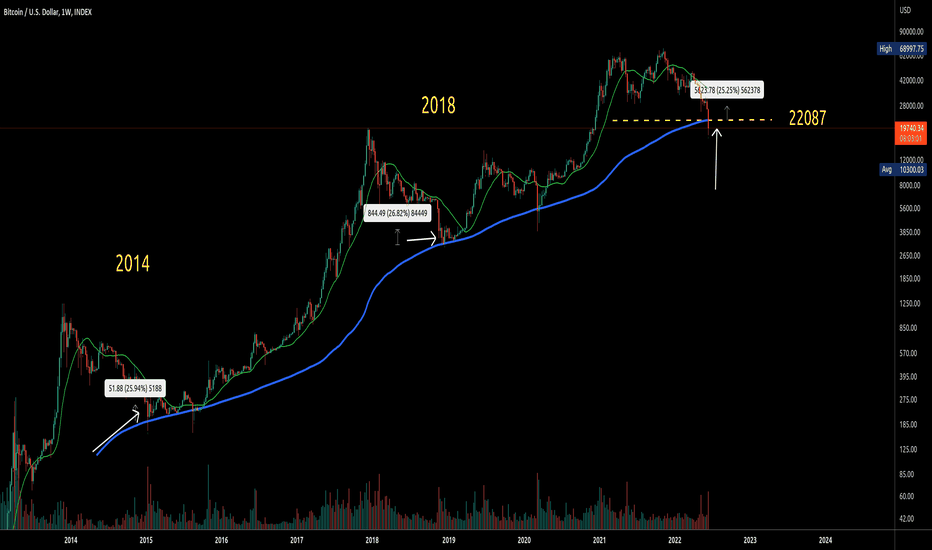
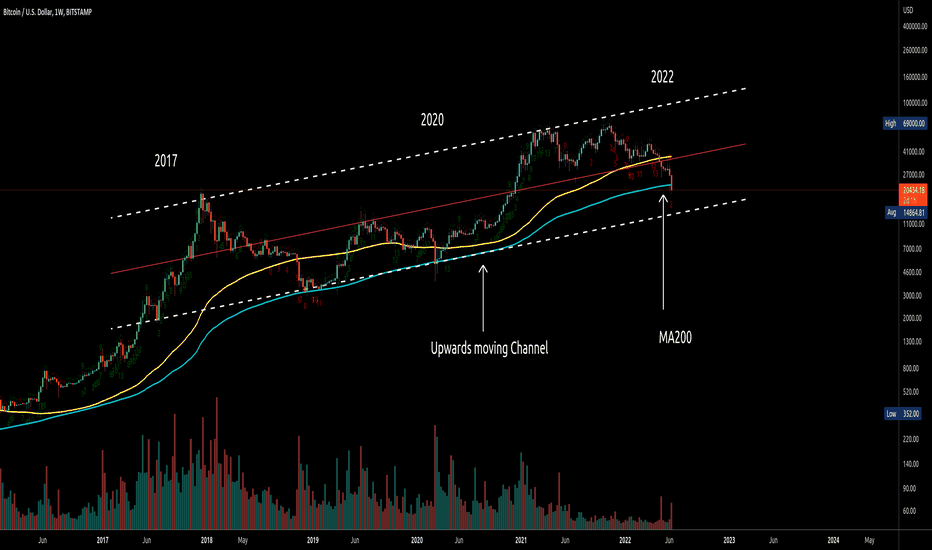
Currently BTC has fallen below the weekly MA200. This is the blue line on the graph if we look back to 2014 and 2018 on the weekly graphs it shows that when BTC was able to move back above the weekly MA200 it moved up a minimum of 25% from this location. What does this mean ? --------------------------------------- This means if BTC is able to close the...
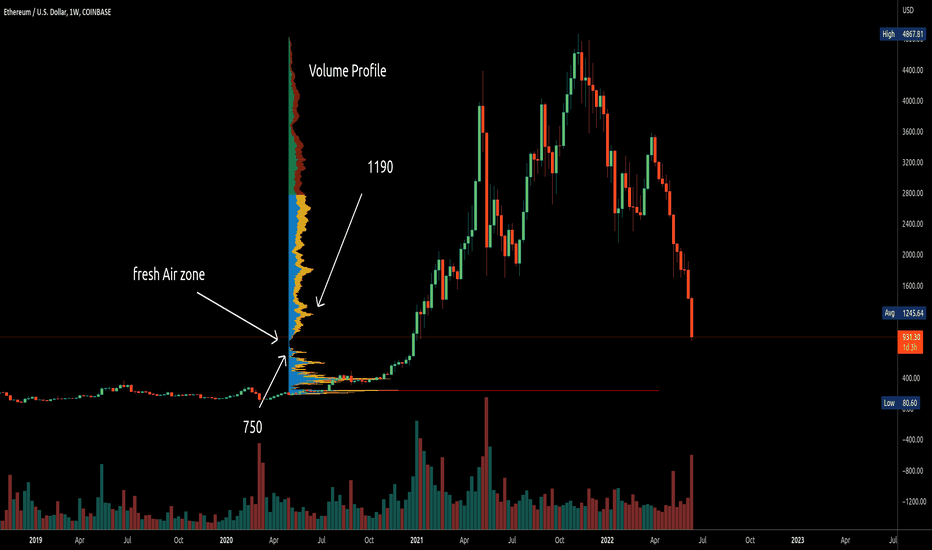
This current level is an important area for ETH as below this level there is no support till 750 . Looking at the Volume profile shows there's only fresh air between 888 and 750 . Which means there is no support in that area . ETH will have to consider a temporary bounce around the current 926 area to avoid heading lower to the 750 zone.
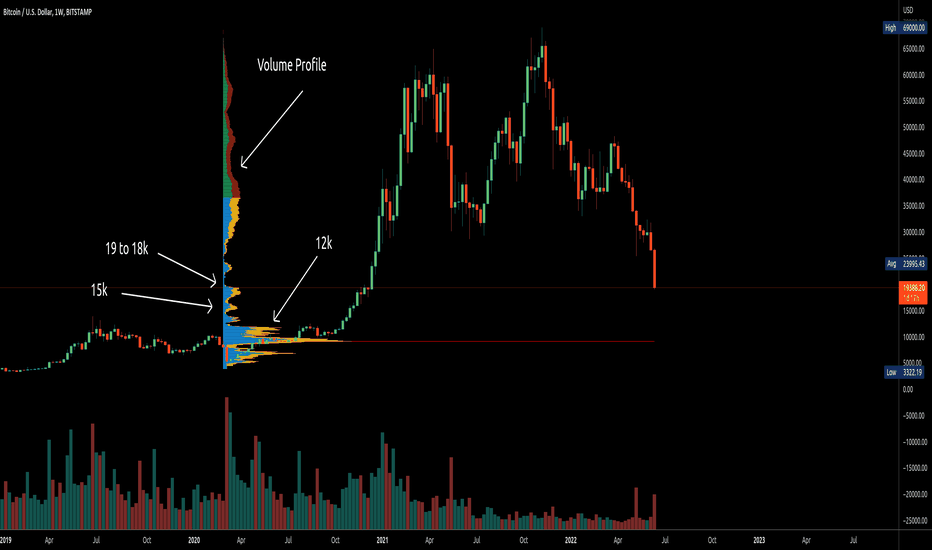
A look at the Volume profile shows BTC has finally hit the first real area with any decent support . This area is the 19 to 18k area shown on the volume profile to the left of the graph if this area fails to hold them the next area down is 15k followed by even weaker support at 13k. If BTC fails to bounce at 15k then id expect it to move down to the 12k...
Something interesting is BTC has been moving in an upwards moving channel since 2017. The current bottom of the upwards moving channel is at around the 13k area. why is this interesting ? ===================== Because if we switch to the monthly the MA100 lines up with the bottom of the channel at 13k Which is a bit of a coincidence if you ask me . If BTC ...
If we slap on the volume profile it shows the current location is a "fresh air zone" or no support zone. The first area of support is shown as the 19200 area. Hence my thought is BTC may move down to this 19200 zone at the minimum.
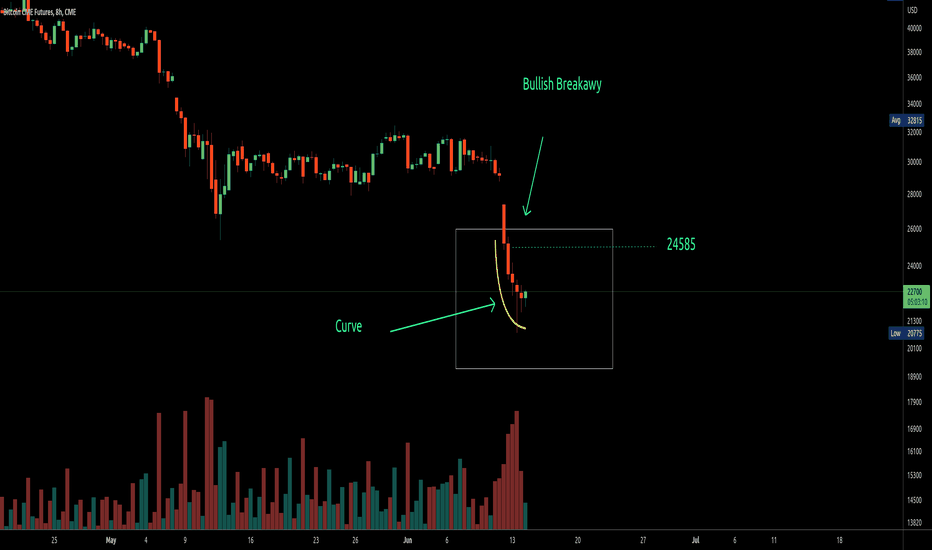
This looks like a failed Bullish breakaway setup which should have moved up after the 4th or 5th candle down but appears to be experiencing technical challenges . Normally if the Bullish breakaway is going to succeed it will do so by the 4th or 5th candle down. In this case the move up should be to the 24585 area; However its been 5 candles down and...


