nisbeat
Would love to know your thoughts on this XRP chart pattern... as you can see with the arrows, clear heads and shoulders i.e. reversal/bearish. But then, there's the lovely pennant, usually associated with an upcoming uptrend/bull market. Which do you believe? what else would you add?
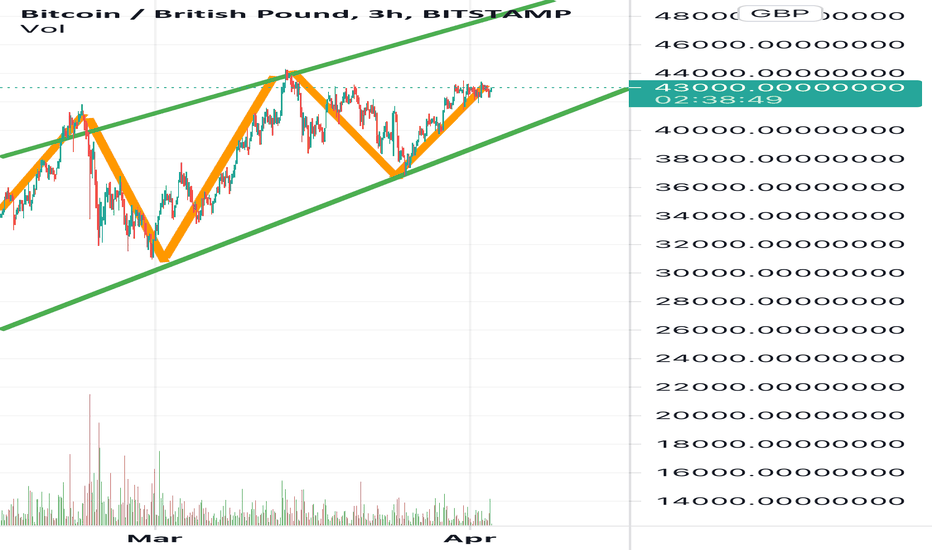
Looks like a perfect bearish rising wedge... basing on pattern trends, that would suggest a bearish run is incoming. Simple mind, simple analysis, simple idea. Who knows really what’s next for us, welcome to crypto 😂
Considering BTC smashed through the previous support level of 38.5k, a 1 month view of BTC movement & a fib retrace would suggest next level of support (61% on fib) is 36k.... lets see what happens! Certainly still stand my previous post about expecting a very bumpy ride this week, hopefully as we edge into April, the bull volumes start to take over. Let me know...
Here's me using the simple EMA analysis. When a short range EMA crosses above a longer range EMA, that would usually mean an uptrend is on the way.. vice versa when the short range EMA crosses below the long range EMA, we have a downtrend. Those can be used as buy/sell signals. Just a reminder that my analysis is using 15 minute candlesticks... the story remains...
Are we seeing here a cross between a flag and pennant? if so could be an indication of a bull run just round the corner... Anyway, back to my other ideas I published, I do still believe this will be a bumpy few days, but still bullish in the long run.
That rock bottom horizontal line seems to show the support is very strong at 38.5k - backed up by my previous post re fib retracement & oscillators. In terms of what the future holds, it does appear to be a repeat from this time last month - in my opinion, the third week of the month will usually be a bear market as the pay check wears off= more sell orders. In...
Will we see BTC hit the trend line...? Again this aligns with the past 2 fib retracements
New to the game, drew a couple of fib retracements which would appear to highlight the price not dropping below the 61% (£38.5k) mark. Could we see a bounce at 38.5k... time will tell.
Based on fib retrace never dropping below 61% in the past 2 uptrend. Will this drop respect the fib retrace at 61% (aka £38.5k)... time will tell right?
Based on fib reta events, can’t see it drop below 61% (38.5k)... therefore buy in at 38.5k?


