preying_mantis
2 Past instances of gold testing highs: scenario 1 is bullish instance and scenario 2 is bearish. Gold needs to hold its 2011 highs if scenario 1 can play out. Which way do you think it'll go?
While on a USD basis, bitcoin is in a choppy area, on a gold basis bitcoin is in a downtrend. It's probably best to compare against a commodity like gold anyways, because it represents buying power better than something like the dollar can. I think a flush in "risk-on" assets like bitcoin is likely in the near future. I'd be looking for a bottom near the 10x gold...
Could DJI/GOLD be rolling over? Or will it have another leg up?
Weakening RSI for SPY vs. BTC, but SPY trying to form a bottom against BTC. Where do you think we go from here?
Seems like a compressed version of what happened in the last major dip may play out. I think a test of the 200 day EMA is possible with a brief dip below being OK as long as we don't start printing daily candles below.
If you've read my recent posts about CCJ you already know I'm long term bullish on Uranium but am waiting to buy the company at a more reasonable price. Based on my theory that we may be repeating the scenario of a long term breakout and correction as happened many years ago (see chart), then we want to look at potential zones of support to buy. Based on the...
APX has begun to give indications that it is breaking out of the long term downtrend (see the red trend-band borrowed from Mohammed_Seeker's post). Reasons to be cautious/remain bearish: 1. Stocks are in a seasonally bearish part of the year 2. APX looks like it has been rejected by the 50 day EMA and has been showing weak momentum 3. I do not see any major...
Weakening daily RSI on Cameco Corp's stock CCJ is signaling the potential for a healthy dip over the next several months. Look at my previous post on CCJ--I think this stock has the potential to outperform the market long term due to a resurgence in uranium demand in multiple parts of the world. The highlighted red area is in a weekly overbought area that last...
Are you tired of me covering BTC yet? BTC appears to have formed a double bottom on the daily with a strengthening RSI trend. The next milestones BTC needs to make in its attempt at a comeback are a close above May 26th's 39.2k close (likely in my opinion) and then a close above the 200 day ema at around 41.7k (more difficult) to support the idea that the break...
"Realized cap seems to suggest the final layer of people’s cumulative cost basis and, in recent history, the ultimate line of “center of mass” where 2017 strong buyers remain unrattled by short-term uncertainty." Current realized price = 20.188k 2.089x realized price (last mid-bull market low) = 42.172k Current 200 day ema = 41.667k Anyone want to predict a low...
Zoom out far enough and Link/Eth starts to look like a bubble in the process of popping. Lower lows and lower highs continue on the weekly chart.
RSI continues to show weakness for Bitcoin. I think we will see another corrective move to test the 100 day EMA. If that breaks, I expect a test of support where the 200 day EMA lines up with support zone near 40K.
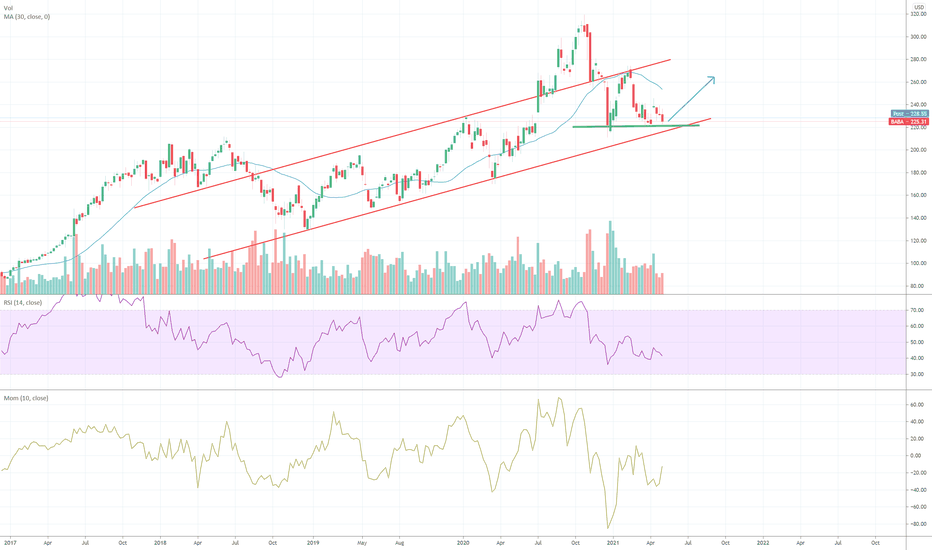
BABA approaching support and the bottom of a long term channel. My opinion is we'll see a bounce into earnings on the 13th and possibly pushing higher depending on the outcome. This growth stock is so "cheap" right now even Charlie Munger likes it. A close below 222 would be an invalidation of the green support line and a weekly close below 217 would probably...
AYX looking like it's rolling over long term. From today's chart on The Chart Report: "A weekly chart w/ the 30 MA can be a useful tool in evaluating cycles. For a more in depth discussion of Stage Analysis, I'd recommend reading Stan Weinstein's Secrets For Profiting in Bull & Bear Markets." A combination of weakening growth and rising debt yields are all...
CCJ is one of the largest Uranium miners in the world. Uranium had a terrible decade, especially with the Fukushima disaster in 2011. However, while nuclear energy has largely been unpopular in the west, China and India have been building and planning more reactors. Additionally, with major updates to reactor designs, the US and elsewhere have seen a resurgence of...
Today we seem to be printing a large red candle which recently has led to dip-buying opportunities. GME has generally respected the 50-day EMA, rallying significantly off of short-term dips below it and I would expect that level (~155ish) to be tested and show support if today's red candle is confirmed. February was the last time that the 50 day EMA was broken and...
Long term the ETH/BTC ratio is looking very bullish. Nearing the top of a channel trend which could provide some resistance but I expect another breakout soon as EIP-1559 and lower gas fees provide a very bullish outlook for the Ethereum network.
After announcing full year results, Appen LTD ASX: APX continued its downward slide to touch support in the 15 AUD region. APX has rallied somewhat recently, but momentum has barely turned positive on the daily and continues to remain negative on the weekly timescales. The 15 AUD level matches up with a past peak in Aug/Sept. 2018 and I believe will be a key area...


