priceprophet
PremiumA lot of strength is being displayed in the SP500. Both the weekly and the daily are showing very strong bull markets. Weekly chart consolidation is broken. Daily consolidation is reset to: 2967.97 - 2995.84 Price Projections still exist for 3055.66 on the daily and 3084 on the weekly. SP500 traditionally walks the upper bands of the ATR range. The close is...
We have strength, but we are far beyond the mean. The Daily charts indicate Strong Bull while the weekly indicate Very Strong Bull. The consolidation has been broken to the upside. The broken consolidation range is: 26049/26907 The Friday close was 10 points beyond the upper ATR Band. Next week we could see a retreat back into the prior consolidation range or a...
Wednesday was amazing! However, one indicator trigger a projection to 8228.99 While a bearish indicator is saying 8211.13 The bearish indicator triggering and nearly matching the other indicator in projection is hinting at a little exhaustion entering into the prices. We could end up generating a consolidation range around 8200 to catch our breath before pushing...
Strength still intact. Can Friday bring it? Looking for 3035.18 - 3055.66 Or will it be a return to the consolidation range to catch its breath after fireworks on Thursday? (Consolidation: 2952.22 - 2977.93)
Happy Birthday America! 26966! Closing above all the HMAs indicates a change in attitude into a very strong bull. Repaint on a RENKO box date, changing to July 3rd (From July 2nd). July 2nd had suggested 26892.57 (Reached!) July 3rd is looking toward 27093.34 This is also paired with a BSI crossing (same projection) and the Bear RSI returning into Bull...
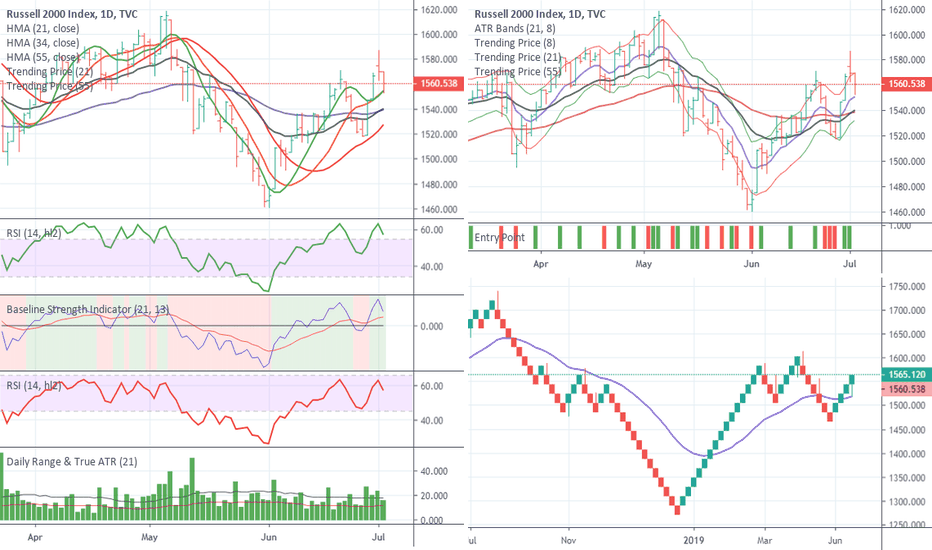
Consolidation has been established with a range of 1548.12 - 1586.77 For the technicians out there who like patterns. A Pivot High was just completed. So, look at the bottom of the consolidation range for your breakout signals. Anchor bar on the consolidation is a positive bar which suggests a 70% chance of breakout to the top. Coupled with the pivot high - I...
SP500 is still demonstrating strength. While Tuesday has placed the index in consolidation between 2952.22 - 2977.93 Weekly charts are caught in consolidation 2887.30 - 2964.15 A indicator triggered that SP500 has a desire to attempt to reach 3035.18 which would break both consolidations While prices to HMA relationship is saying that a strong bull exists. The...
2 July provided a slow day in the DJIA. However, the close managed to secure a new Renko box. DJI is currently in consolidation. Both at the weekly and the daily levels. The daily level has a resistance of 26907.64 and support off 26465.32 The Prices to HMA suggest "cover the longs" or "lock in gains". The projection triggered from the new Renko box suggests...
Friday the price chart generated an engulfing bearish bar. Monday the prices closed between Fridays prices suggesting either consolidation/turning. Tuesday it broke through the floor of Fridays price, crossed the 21 MA and 55 MA and closed under the 34 HMA in "cover the long" territory. Also, with the prices below the two trend lines - it suggests that the...
**Disclaimer** I don't trade BTC. I am apply the Price Projection Theories against it to see how well it stands against the massive swings of BTC. Weekly and Daily trade zones are caught in consolidation. Weekly Consolidation: 10300 - 13880 Daily Consolidation: 10300 - 13355.61 Weekly projected a signal for 15,441.11 before locking into consolidation. The Daily...
Personally endured an internet brown out this weekend. This is getting released late. Weekly projection aiming toward 61.69 Bullish going into the weekend. OPEC+ announcements are exciting for the market. Expecting a range this week of between 56.37 - 60.57
Personally endured an internet brown out this weekend. This is getting released late. No new projections this last week. Very Strong Bull going into the weekend. G20 announcements are exciting for the market. Expecting a range this week of between 7898.6 - 8221.4
Personally endured an internet brown out this weekend. This is getting released late. No new projections this last week. Very Strong Bull going into the weekend. G20 announcements are exciting for the market. Expecting a range this week of between 2909.44 - 3026.97
Personally endured an internet brown out this weekend. This is getting released late. Noticed immediate change in strength of the Russell after reorganization. No new projections this last week. Bullish going into the weekend. G20 announcements are exciting for the market. Expecting a range this week of between 1542.80 - 1629.23
Personally endured an internet brown out this weekend. This is getting released late. No new projections this last week. Very Strong Bull going into the weekend. G20 announcements are exciting for the market. Expecting a range this week of between 26291.26 - 27413.71
Small caps rejected the high before the other indexes. Indicating a close below the 34 HMA to cover and long positions and prepare to short. The Bull RSI has indicated a price projection of 1504.95 The BSI has indicated a price projection of 1470.63
NASDAQ has closed below the 34 HMA signalling to cover longs. The BSI has indicated a price projection of 7780.63
SP500 has signaled to cover the longs by closing beyond the 34 HMA. The Bear RSI has signaled a price projection of 2887.63


