Zoomed out view of BITSTAMP:BTCUSD on weekly view. Macro inverted head and shoulders with a falling wedge. Chart also has previous trend channels. On a macro basis, I think this is bullish. My guess is that we might get rejected by the 8 week VWAP and retest the prior trend line at ~$88k. However... I could also see this getting momentum and breaking out of...
Went long on this. Going to be a longer hold. There's a gap on price in the daily at $36. Given the recent momentum in NASDAQ:META and NYSE:SNAP , I think we'll see this name get carried along. Still have to clear the EMAs and VWAPs but with a wedge in play and a healthy bounce off the bottom, I'm betting we get some momentum here. Bullish in the medium...
Yep, them are some fightin' words right there. But, on a monthly chart, Gold / BTC tells a potential story. It may not happen this year, but it looks to be shaping up. A black swan event could actually be a reversion to a gold standard or something similar, causing sovereigns to scramble for physical gold, causing the price to skyrocket. Perhaps capital controls...
I've had that chart drawn out for a while. Since 2018, we've had an interesting cyclical pattern of 60% drawdowns for 9-11 months every 38 months. I'm short until ~November and/or until we reach ~$50-60. At that point, I'll turn bullish again and go long.
It's worth looking up the Raydium protocol but as it stands, this is one of the best alt cryptos that will outperform Bitcoin. Currently giving us a bullish flag on daily and breaching macro trend line. I'm long on this versus $SOL.
Macro trend analysis for Bitcoin. We are just breaching the prior trend line and it looks like this could be clear air to the macro top trend line. My high-end estimate is $300k with a settled estimate of between $150k-$225. Too early to tell but 2025 will be a wild year. As we get more data, I'll update. As of right now, I'm max long and still accumulating on...
Macro view of Brazil. Symmetrical wedge with a bias to the downside due to the price being below all macro VWAP + large volume shelf. Short on the macro basis.
Looks absolutely primed. Bouncing off all the monthly VWAPs/EMAs. Loads of price support. This could easily go to $276 and potentially $360. I suspect this may go nuts if the Feds cut rates in Sept.
Looking pretty bullish. Just cleared all the weekly VWAPs and EMA on today's close. Right at the volume shelf. Monthly still has some VWAPs to clear but I think over the next 4-6 months, this could be a great breakout play. Bullish and am currently long.
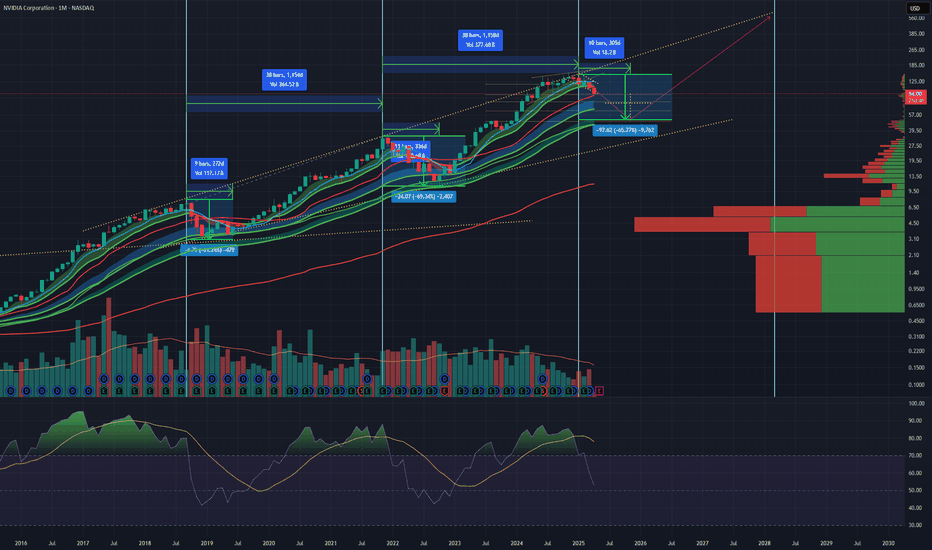
Yep, I'm a contrarian. It is time to short $NVDA. Way overbought on RSI. Decreasing volume. Wicking candles... and, on top of that, I see some cyclicality here. We tend to see this with Nvidia since 2018 where the rallies are followed by a quick precipitious drop. The next cycle shift should start in January and should likely be a 6-month drawdown. I'm betting...
Pretty clean chart. Symmetrical wedge with bullish bias. Above all monthly VWAP and EMAs. Just needs to clear the $371 volume profile shelf and then it should send it. Macro monthly place. Long.
I'm long on $MLPA. Energy play. With geopolitics heating up, this will likely benefit. Monthly looks great as we trend up through levels. We're about to hit a critical level and if it breaks through, I suspect we see $58-68 over the next 12-24 months. It's a >7% dividend as well so one of the few trades where you can hold for a few years, gain lots of value, and...
Pushing hard on the top of a rising wedge. Monthly candle needs to close green.
Title says it all. Tight symmetrical wedge forming on $RAYUSDT. Looks great on the volume profile. Weekly EMA and VWAPS are supporting. I'm in but lightly for the moment.
Symmetrical wedge above all EMA and VWAP. Clear air on volume profile. This thing could go quickly.
Weekly chart. Large bullish engulfing candle within the wedge. We're now about all VWAP, EMAs, and above the majority of the volume profile. I'm expecting that we retest the upper macro trendline. Bullish.
Weekly chart. Cup and handle forming for a more macro trend trade. Last candle is a beastly one. Long on this trade and expect new highs soon.
Macro chart. Monthly for $EOG. RSI is falling/moving lateral. all VWAPs and EMAs are underneath and supporting. With shakeups in the oil market with Russia and what not, could be a good play for next 12 months.


