saintprincevvs
After failing to recently break the high - I believe EURUSD will seek to dump to the downside. Hold your hats - this may be a swing sell. We can be sure that the bias has changed though!
Price has confirmed the change - not a strong confirmation but one nonetheless. For that reason, wait for price to retrace back into one of the drawn up POIs in order to decide where to sell from - If I get further signals that a sell will occur. It should sell all the way to the bottom.. Next week should be interesting N.B.: This is not financial advice....
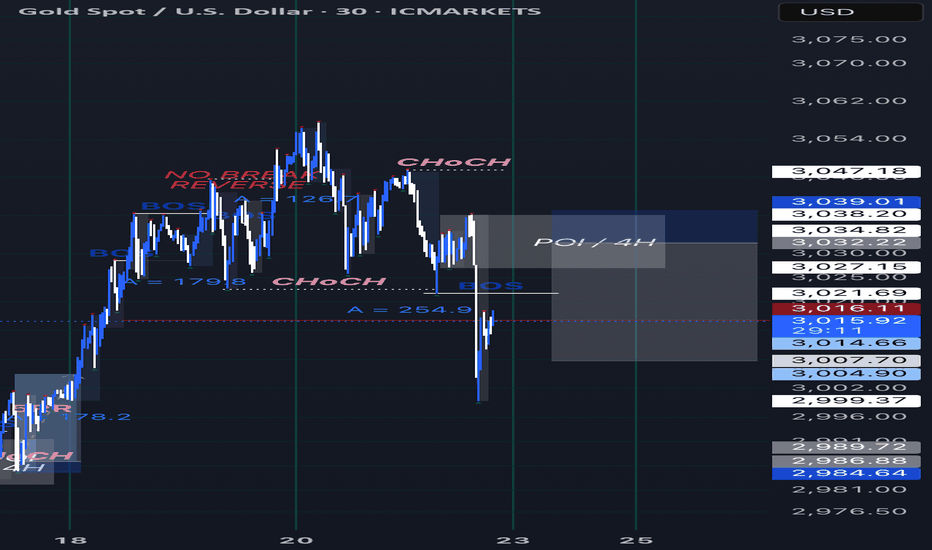
Gold ended on a high, seeking to return low. It changed character breaking the most recent low, signalling to me that it will seek to go low once it collects enough liquidity to expand again. What I drew up on the chart is essentially what will happen but it will be a hypothetical, I’d suggest that you refine if you are seeking to take this trade But theory still...
After struggling to continue the sell - I have no desire to look for a sell but a buy. Recent Asia high was broken, I’ll wait until NY for price to retrace to POI in order to look for a buy.
This is different to what I had initially devised. It looks like character has changed to go to the upside - I am expecting gold to push up instead now. I’ll try and update where I can. I have no entries atm this is just a theory. N.B.: This is not financial advice. Trade safely and with caution.
Gold is at a crossroads. After continuously breaking ATH records it is now looking tired. It has given me signs of a potential reversal. A break to the downside would confirm that. I have reason to believe that it’ll begin dumping the second smaller opens. Even then a break downwards would help us make a decision. N.B.: This is not financial advice. Trade safely...
Need an aggressive move forward down - violating recent lows to start the sell motion. I believe NJ will look to sell off
Price has been ever so bullish. Taking advantage of that opportunity. RR: 5 N.B.: This is not financial advice. Trade safely and with caution.
This is a theory. I believe price on the weekly is clearly over extended. With the NFP incoming, it may seek to fall from here especially with a clear setup occurring on the W TF. I believe price to be bearish at this point, having interacted on the weekly POI - Please look at the charting before making any decisions, and let me know what you think of it. N.B.:...
From what I’m seeing price is seemingly fatigued. There was a credible break on the 4H chart though - which is low-key worrying, HOWEVER on the daily chart? Sweeps on sweeps - which to me certify that price will be seeking a reversal of some sort at some point. Once one of the printed lows gets violated by price (as drawn on the chart - with a candlestick) the...
Price has been breaking down ever since. There were clear sweeps and breaks leading to price seeking to stay bearish. RR: 4.91 N.B.: This is not financial advice. Trade safely and with caution.
I think it is quite obvious that EURUSD will continue to the downside as predicted earlier. It is simple following larger TF order flow RR: 6.51 N.B.: This is not financial advice. Trade safely and with caution.
Price has been bullish overall. While it has been overall bullish - price hasn’t broken from its consolidation, therefore in the meanwhile we’ll take advantage of the situation. Price has broken down on the 4H TF, so we’re looking for an optimal entry. Although I have marked out FVG - I believe the uppermost order block is a great place to enter from. RR 1 :...
Price will seek to continue trending in the same direction in which it came down. A few breaks on the bigger TF helped me confirm this buy. RR: 3.98 N.B.: This is not financial advice. Trade safely and with caution.
Clear bias being shown. Price rallied up only to pull back. Last order lock is so clear RR1: 2.96 RR2: 4.09 Realistically you can let it go too. There’s better TP prospects. N.B.: This is not financial advice. Trade safely and with caution.
EURUSD has continued its trend by seeking to break downwards after taking out the liquidity resting above it. RR: 6.42 or for earlier entry (bottom of OB) around 4.8 N.B.: This is not financial advice. Trade safely and with caution.
Price had a huge swept and then broke downwards. This was worth looking into. RR: 2.25 N.B.: This is not financial advice. Trade safely and with caution.
Price has already tapped in. I’d look for a clear entry before entering. However this is clear - price did not break aggressively on the way down - rather up. I’m expecting a buy with ≈ RR: 2.5 N.B.: This is not financial advice. Trade safely and with caution.


![GOLD SHORT | SELL THEORY [24/02-01/03] XAUUSD: GOLD SHORT | SELL THEORY [24/02-01/03]](https://s3.tradingview.com/l/l7Pu7crb_mid.png)


