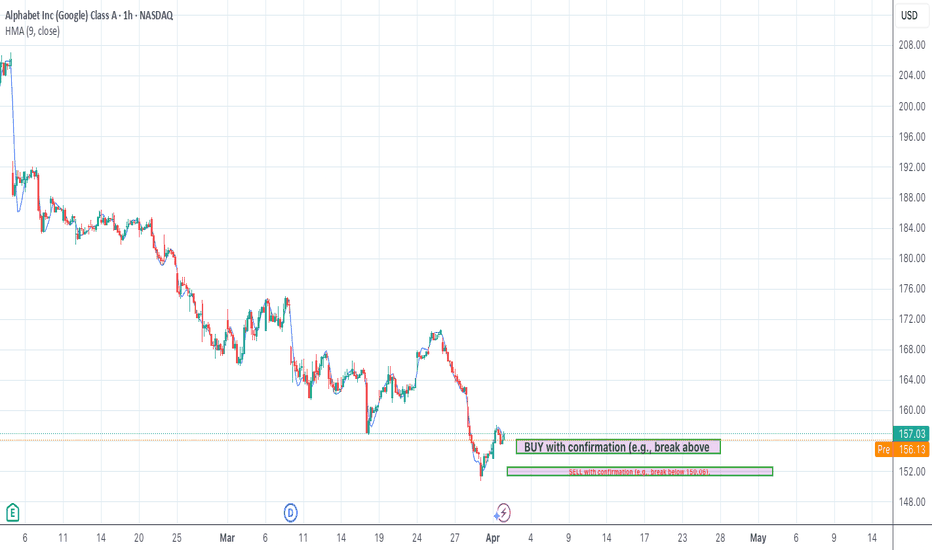
The analysis focuses on the short-term to medium-term timeframe. Tug-of-War Between Bulls and Bears: At the current price of 157.04, the market is in a tug-of-war between buyers (bulls) and sellers (bears). Bulls are defending key support levels near 152.48 (Fibonacci 100% retracement of Wave C) and 154.34 (Expanded Flat target). A hold above these levels could...
Tug-of-War Between Bulls & Bears: At the current price, buyers (bulls) are defending the EMA (10) at 3163.00 and the SMA (10) at 3160.89, while sellers (bears) are testing the R1 pivot at 3184.60. A break above R1 could signal further bullish momentum, while a drop below EMA (10) may indicate bearish pressure. Recent Price History: The market has been in a strong...
The market shows strong bearish dominance with price (22,207.79) below all key moving averages (EMA200: 22,743.51). 3 Bearish Confirmations: ADX 35.85 + -DI (36.59) > +DI (11.27) = strong downtrend RSI 28.53 shows oversold but no reversal momentum MACD (-139.49) remains below signal line (-116.26) Price struggles below Camarilla pivot (22,680.36) with immediate...
BTCUSD 10.03.2018 4H timeframe BTC got to 7000$ my technical analysis of market BTC/USD.
my technical analysis of market BTC/USD.
Let's take a look at USD vs EUR on the short
Bitcoin 4h Chart Let's take a look at Bitcoin vs USD on the short term, the 4 hours chart.
NEO 4h Chart 16.02.2018 NEO 4h Chart Let's take a look at Bitcoin vs USD on the short term, the 4 hours chart. Since reaching our Bottom on the 6th February
Bitcoin 4h Chart Let's take a look at Bitcoin vs USD on the short term, the 2 hours chart. Since reaching our Bottom on the 6th February


