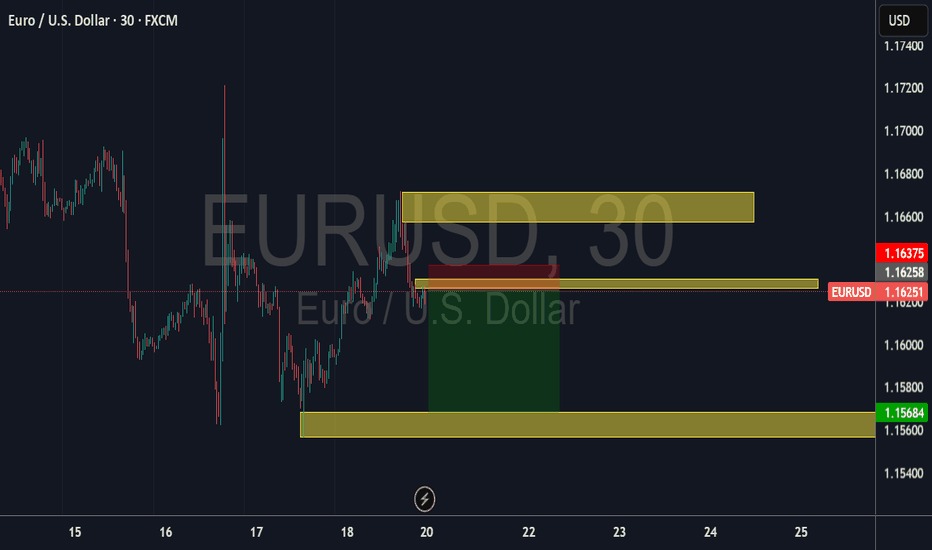
Currency Pair: Euro / U.S. Dollar (EUR/USD) Timeframe: 30-minute intervals (H1) Data Source: FXCM Price Data: Open: 1.16265 High: 1.16275 Low: 1.16189 Close: 1.16251 Change: -0.00014 (-0.01%) Price Levels: The chart displays price levels ranging from 1.17400 (highest) to 1.15400 (lowest), with the current price near 1.16251. Notable levels include...
The chart indicates a bullish bias in the short to medium term, with Wave C targeting higher Fibonacci extensions. However, key levels to watch are: 110.00 (resistance). 108.70 (support). A break in either direction will provide confirmation for the next significant move.
This chart shows the GBP/USD currency pair on a 4-hour timeframe with an Elliott Wave count labeled (1) through (5). Key observations include: Elliott Wave Analysis: The wave count suggests a completed impulsive wave downtrend, currently in Wave (5), indicating potential bearish continuation. Support Zones: Highlighted yellow rectangles mark significant support...
GBP/USD chart on a 1-day timeframe with clearer indications and a refined trading plan. Here's a detailed breakdown of what has changed and the current market outlook based on this chart: 1. Wave (5) Projection: Wave (5) remains highlighted as the final upward wave in this Elliott Wave pattern, suggesting a continued bullish trend. A red arrow indicates a...
an Elliott Wave analysis. Here's a breakdown of what the chart might indicate: 1. Elliott Wave Count: - The chart shows a series of five waves, with the current price action seemingly in the fifth wave (labeled "(5)"). - This suggests that the pair is in an impulsive upward trend, with the potential for a fifth wave to complete the current rally. 2....
GBPUSD has been doing some nice patterns showing a good fall .let see how it plays out
so GU has respected all we expected it to do, we going to take a long ride on it
GBPUSD has been consolidating for a while now , and it time to take a big profit on Short
so been looking at DXY form a very good support to demand for supply .
pack your baggage and let ride on. so the price has been testing this resistance on the 4wave thus the correctional phase, gathering momentum to fall and complete the 5th wave on the cycle
price broke through the 61.8 fib mark and looking to make the day down to the 50% mark on the fib. also price from the highest monthly resistance was rejected and made it correction move after the first impulse move to finish the second 2 correction, then we can resume the 3rd impulse move.
this is all i see waited for the final touches on the fib 50% mark where it is a key support areaa
consider long positions above the level of 1.2503 with a target of 1.3300 – 1.3500 once a correction is formed on the last 3 impulse 3 wave , the 5th wave has just began
so the five-wave move has been completed and waiting for the ABC move to complete the critical support to begin the last 5 waves of the significant wave on the daily chart
so we looked and now we leaping ......there is always a rise after the fall
After the first correction at the beginning of the year price rejected the support @ 1.8403 and bounced off to begin the 2nd wave. after seeing few rejections from last week ceiling broke the 50% FIB retracement it got another rejection and now coming to start to form the beginning of the year low


