spyxo2x
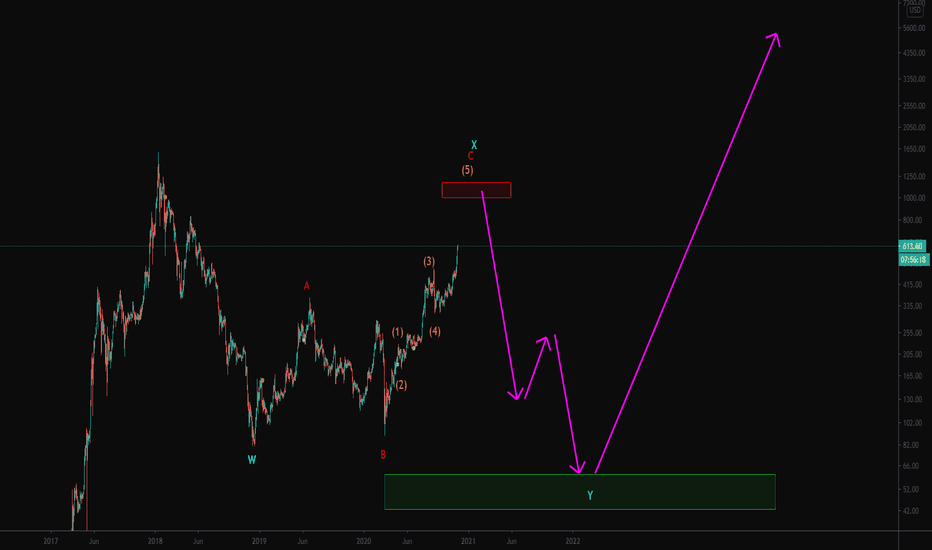
Forecasting ATOM/USD for the coming year. I'd say around 78% likelihood that this scenario pans out. -Hawk
This scenario will be in play if ETH breaks past the $620-$660 resistance. If the resistance holds, we will see the crash from these levels. -Hawk
The way I see it, Bitcoin is at a very strong sell zone. There are 2 scenarios. 1) It drops from 16820 (from here) 2) it performs a bull trap by breaking the resistance trendline and hitting the stoplosses there. That would make a target of 17,580, after which it would drop. The 16,820 short position would be invalidated if the price pushes past 17,060. If...
ETH is currently offering a much better RR trade than BTC. -Hawk
This bull run is soon coming to an end. -Hawk
Here is the count and support zone calculated for the previous bear market: This is the link to the algorithm that I use for my Supply / Demand zones: -Hawk
Odds are that the correction has started. Support 1: 12.3k Support 2: 11.8k Once this correction ends, we should see the final impulse of this bull trend (14-16k target). -Hawk Larger timeframe: For those who are interested, I use this algorithm to calculate the Supply and Demand zones:
I'm expecting the last wave of this bull run to end around 14-16k -Hawk Smaller timeframe: For those who are interested, I use this algorithm to calculate the Supply and Demand zones:
This chart shows two premium indicators that were custom made by myself. Oracle sees the future, while Zeus sees the present. The combination of these scripts provides a significant edge in the market. -Hawk Oracle: Zeus:


![Showcasing Oracle & Zeus combined [Premium Algorithms] BTCUSD: Showcasing Oracle & Zeus combined [Premium Algorithms]](https://s3.tradingview.com/3/30R62frB_mid.png)
![Possible BTC daily cycle [Elliott Wave] BTCUSD.P: Possible BTC daily cycle [Elliott Wave]](https://s3.tradingview.com/j/JOIm0IX5_mid.png)


