sr5
Where will BTC go this time? Bull run increases seem to be a factor 5 less each time, that would bring us tot 125% this time.
My dog (Mr. Trump) just drew this curve on the BTC chart and I think he might be right. I'm putting in buy orders all the way down to 3.5k and then it's just being patient until I can afford him some moon dog food. Disclaimer: although this is the best TA currently available, this is not financial advice and neither me or my dog can be held responsible for any...
Included the S2F prices on this 4y halving cycles model. Given that the prices overshoot the S2F model we should be expecting prices around 150.000 in this bullrun, however this feels like a long shot. I'd argue that we will definitely see the 50k range this run, but anything above is yet to be seen. What do you think? In the next cycle the S2F seems to exceed...
Modified current timebox; added 4chan predictions for fun
I believe we're in the run up toward bubble territory. This means that there is a big upside possible, but we shoudl take profit when there's a clear breach of 2.4 mm and as soon as a top is becoming visible.
XMR is on a track to loose a lot of value comapred to Bitcoin, at this point there is not much resistance anymore and we can fall deep! Has Monero become a shitcoin which will collapse? What are your thoughts?
This is another view on the prediction for Bitcoin based on the halving cycles. This is based on the graph of Tuur Demeester, credits to him. One take-away could be there will be a chance to get it around 20k at a much later time, but if you can invest now you could take advantage.
This is just one of the ideas where Bitcoin will meander through 2019 around current levels before breaking out end of 2019.
This time, I did trend analysis on the moving average. From a different perspective, I again come to the disappointing conclusion: 1 year more bear for BTC! In order for our moving average to continue the trend, some neutral-bearish price movements are needed for another year. Targets: * September next year only we accelerate up, leaving the current price...
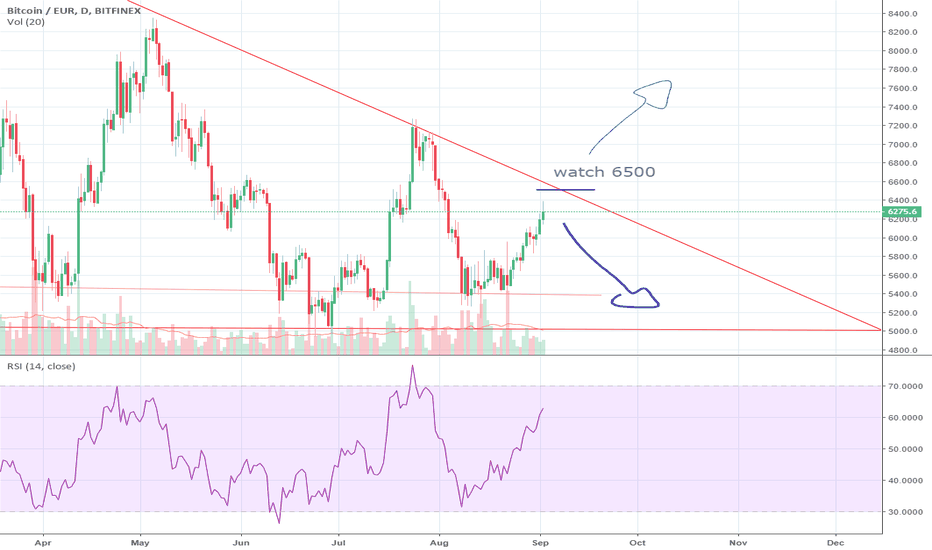
(Using USDT to keep mu USD chart layout) We are reaching the end the triangle resistance. Will be break out up or down? If up, this might be very bullish. If down, there is still some room to remain in the triangle for bearish movement towards 4900 USD.
Short-term expecting reversal around 6500 EUR
Below current support levels there's not a lot to keep a falling price! If we can keep current support, we could just continue horizontally for another year
Trend analysis indicating meandering through 2019 and then breakthrough EOY '19


