sweatytrigger
PlusMarket mix up. NASDAQ:TSLA Eyeing this, positioned for a couple weeks out on my calls which are ugly red but, I think this is setting up for something in the next few weeks? Although, feels like tariff talks again are not letting this run as well. #NFA
Tesla doing NASDAQ:TSLA things. This moved so sluggish and slow and I guess it was forming and waiting to set something up. If everything else goes smooth tomorrow, I’m looking for a Tesla’s to break out of this bull flag to the upside and retest that 350 range again and hopefully eventually break up to the upside. I already have calls that I’m swinging but...
Big cup and handle? I feel like NASDAQ:TSLA has so much potential here. Ready for a break out of this handle. I have long calls for 5/16. Looking for over 295 to possibly 300? Then big move to $324?
TA on SPY but I also like playing SPX. Was seeing this as either a rising wedge, and if play (with FOMC etc.) can touch and retest 551.41 then back move back up to test 562.81 and to out at 567.85 IF market reacts well to FOMC, maybe ATH? If not, we actually fulfill that rising wedge to 543.54 with a small gap to touch/retest at 534.54 I may sit sidelines...
Liking how NASDAQ:TSLA has been moving. Lot of momentum and strength. Looks like it’s forming another loaded wedge. Maybe a break upside? Calls: Green ray at 319.77 Puts: Green ray 315.55 Data as well tomorrow. CPI! NFA. Do your DD!
Costco looks loaded. 4 touches along the resistance, looks like a big wedge forming. Next touch can be a break out to upside, fill gap and move with momentum upside. OR Green ray for the entry to downside. We got data tomorrow as well.. Do your DD! Not FA but let me know what you think!
What Im seeing for now. Looking for a gap fill into tomorrow. My puts though are red, planning to swing my SPX puts. FOMC tomorrow, de-risk SP:SPX
Looking like there is apparently “no tariff talks” per China. We’re still in such an uptrend, but looking for a short-term pull back on negative news. Also we have FOMC this week. Does Powell give what Trump and the people want, a rate cut? I’m looking for 5678.33 to - TP1: 5672.46 - TP2: 5635.06 Possible touch or fill gap of below 5603.21? Let me know...
Good push at end of day on 4/30 at close. Zooming out, it’s starting look like it’s forming a H&S. I’m starting to see a lot of people flipping bearish as well. But, also near close today, volume was not promising, declining at the close. I swung short-term puts on SPY, I like SPX puts for a day trade due to this formation but this H&S can possibly out within...
Looking like it’s consolidating. Looking for another leg up if we get momentum. Entry is my green ray. We have robotaxi info from last ER, I think it’s ready to move again. Not FA! But let me know what you think!
Lowkey top watch for the next few weeks! It was a chop zone last week = consolidation? Now zooming out, it’s looking like a loaded wedge/flag forming. A lot of bearish sentiment, tariff talks and unknown lately but this is looking mighty interesting of a formation. Volume also slowly declining, wondering if we’re setting up for once a decision/mutual agreement is...
SPX looking a bit tight, possibly a rising wedge? Tariff news has been such a wash up. Tariffs on/Tariffs off. A lot of moving pieces and indecision. If the news is false regarding electronics not included, then markets can possibly take a downturn. Green ray is my entry, I’m looking for a short. But tbh, any one word “positive” said can move things up and...
Not FA* A lot of set ups looking like flags. Missed the move up but caught puts today for good profit. Or decent profit. I have yet to conquer on how NOT to sell too early? Anyone have any tips? Set up I’m seeing right now (SPY/SPX): Looks to be flagging. Green Ray for a short entry Overall sentiment still feels very bearish. Trump seemed to postpone the...
SPY broke down the Weekly demand line and now looking to break the Monthly demand. Looking to possibly test the bottome weekly trendline. Possibly a 530 price target and if weakness continues, possibly below more to 520 then 510.46 to fully retest that bottom trendline. The market has bene crazy, people calling bottom, wanting to catch the reversal. I mean, I...
BRK.B seems to be playing opposites with the market. Green rays are the possible entries for either calls or puts.
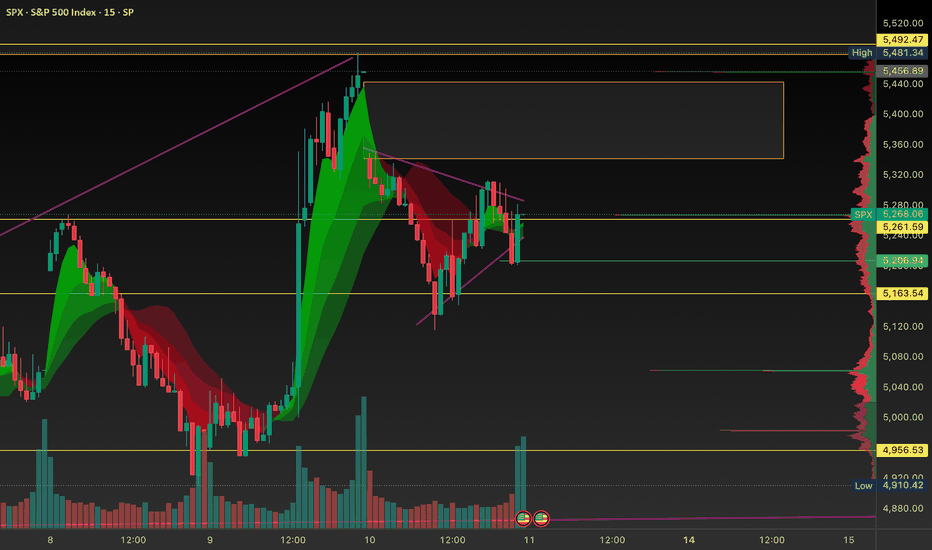
Just started using volume shelves on my charts. Can anyone help with more knowledge or using it as a tool as an edge toward trades? If I’m not mistaken, the higher bars (extending most to the left) are areas of high trading volume and can act as support areas?
Continuous tariff new’s scaring the market. Many continue to say Bearish then some say Bullish. Looking like it can retest the demand zone I see at the 1M at 584.83 but today 3/30 on AH looks like things may be gapping down already. What are your thoughts?
Data tomorrow can change all the set ups. Green rays for possibly entires above or below. I just added volume shelfs and still trying to understand them. If anyone has insight, leave me a comment! Thank you!


