swingstocktraders
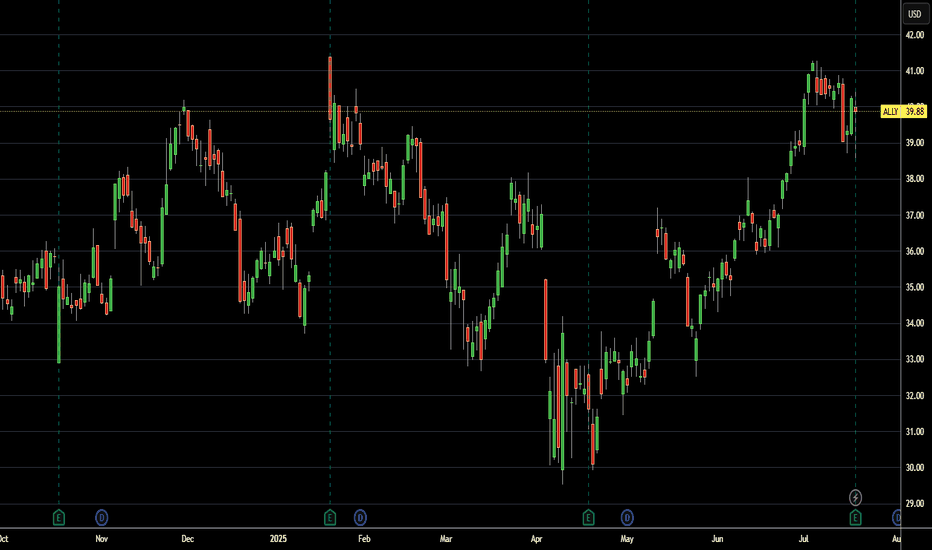
🎯 Summary “X-style” Trade Idea ALLY at $39.88 Signal: MACD + momentum + MA trend intact Entry: near $40 or on dip to $39.50–39.80 Target1: $45–46 (~12% gain) Target2: $50 (~25% gain on full breakout) Stop: below $38.50–39 (just under support/20‑day MA)
🔍 Chart Setup & Trend Timeframe: Daily chart Trend: NASDAQ:NSSC has recently rebounded from support around $28 and is attempting a short-term recovery after a corrective phase. The price is back above the 20-day EMA, signaling renewed buying interest. A move above $31.00–$31.50 resistance could trigger a bullish breakout. 📊 Key Technical Indicators RSI:...
🔍 Chart Setup & Trend Timeframe: Daily chart Trend: After a prolonged downtrend, NASDAQ:ON appears to be forming a base and attempting a short-term reversal. It is testing resistance around $57, and a breakout could trigger bullish continuation. Price is approaching the 50-day EMA, which is a key level to watch for confirmation. 📊 Key Indicators RSI: ~52 ↳...
📉 Technical Analysis Stock Price Action (June 17): $26.19, up marginally 50-day SMA: ~$24.30; 200-day SMA: ~$26.38 Currently near 200-day moving average resistance Momentum & Strength IBD RS Rating: ~86–87 — signals relative strength over the past year SmartSelect Composite Rating: upgraded to 96, reflecting strong fundamentals & technicals EPS...
📊 Technical Analysis As of May 23, 2025, NASDAQ:CORT is trading at $77.82, reflecting a 2.37% increase from the previous close. Key Technical Indicators: Price Trend: The stock has shown a strong upward trajectory, with a 168.46% increase over the past year. Moving Averages: The current price is above both the 50-day and 200-day moving averages, indicating...
📈 Key Bullish Indicators MACD (Moving Average Convergence Divergence): The MACD value is positive (0.329), indicating bullish momentum and suggesting a potential continuation of the upward trend. Relative Strength Index (RSI): With an RSI of 58.03, the stock is in a neutral zone, but the upward movement implies increasing buying pressure without being...
📊 The Trade Desk ( NASDAQ:TTD ) – Stock Analysis 🔍 Fundamental Analysis 1. Company Overview: Name: The Trade Desk Inc. Ticker: TTD Sector: Technology / Advertising Business Model: The Trade Desk is a leading demand-side platform (DSP) for digital ad buyers, enabling programmatic advertising across various channels such as display, video, audio, and connected...
📊 Technical Analysis Overview 📈 Moving Averages Short-Term (5–20 days): The 5-day and 20-day simple moving averages (SMAs) are at $16.91 and $16.02, respectively. With the current price above these averages, this suggests a short-term bullish trend. Medium-Term (50–100 days): The 50-day SMA stands at $20.08, and the 100-day SMA is at $18.52. The current price...
📊 Stock Analysis: P3 Health Partners Inc. ( NASDAQ:PIII ) – April 2025 This report provides a comprehensive evaluation of P3 Health Partners Inc. ( NASDAQ:PIII ), integrating both fundamental metrics and technical indicators. The stock demonstrates strong potential, combining undervaluation with outperformance across multiple timeframes and market conditions. 🔍...
Analysis of NYSE:AEM Stock Performance 1. Strong Momentum and Price Performance NYSE:AEM exhibits strong momentum characteristics, with the stock price trading above short, medium, and long-term moving averages. Additionally, it has achieved a new 52-week high today, indicating strong bullish sentiment. The RSI (Relative Strength Index) also suggests price...
Technical Analysis Li Auto Inc. (LI) has shown impressive growth in recent months, with the stock price increasing by 58.49% over the last six months. As of today, LI is trading around $26.40, experiencing slight volatility but maintaining a generally positive long-term trend. The stock’s 52-week high is $40.13, and the 52-week low stands at $17.44, indicating...
Current Market Overview The stock NASDAQ:AVDL is exhibiting strong bullish momentum, with a promising risk-to-reward ratio that favors an upward movement. Based on recent price action and key technical indicators, the first target level is set at $8.96, representing a 15.9% profit potential from the current entry price. Risk Management and Stop-Loss...
Technical Analysis : Current Price and Target: The current price of $10.19 the target price, with a potential profit of 11.3%. This suggests the stock is in a position for possible short-term growth, assuming market conditions support upward momentum. Profit/Loss Ratio (P/L Ratio): The P/L ratio is 3.3:1, which is considered favorable. This means for every...
Growth Potential Given the current price of $166.11, reaching the target of $190.12 implies a potential upside of approximately 14.5%. Considering Alphabet's strong financial performance, positive analyst projections, and ongoing innovations in areas like quantum computing and autonomous vehicles, the stock appears well-positioned for future growth.
Fundamental Analysis: Recent analyst activity indicates a positive outlook for V2X Inc. On January 21, Citigroup upgraded the stock, reflecting increased confidence in the company's performance. Additionally, the company reported earnings of $0.78 for Q4 2024, suggesting stable financial health. Technical Analysis: The stock has shown a positive trend...
As of March 6, 2025, BJ's Wholesale Club Holdings Inc. (NYSE: BJ) is trading at approximately $110.46 per share. Moving Averages: The 50-day moving average is currently at $100.8, while the 200-day moving average is at $91.1. This 'golden cross' indicates a bullish trend, suggesting increased short-term momentum relative to the longer-term trend. Support and...
The stock has experienced notable fluctuations over the past year, reaching a 52-week high of $61.61 on May 24, 2024, and a low of $37.77 on January 13, 2025. Currently, MRUS is trading above its 50-day simple moving average (SMA) of $42.11 and its 100-day SMA of $45.67, indicating a potential bullish trend. Technical indicators such as the Relative Strength...
Technical Analysis As of February 28, 2025, ONEOK Inc. (NYSE: OKE) is trading at $100.39. The stock has shown a bullish trend in the long term, while the short-term trend appears bearish. Key support levels are identified at $95.81 and $93.97, with resistance around $102.90. The Relative Strength (RS) Rating has improved to 73, indicating enhanced price...


