titusj
Investors show no interest in profit-taking until NAB earnings reports are published in May. The price movement is squeezed around the pre-covid resistance level. Instead of buying NAB now, it's better to see how the market will react to the earnings report. If the ascending triangle is broken, the price will move to the next resistance level quickly. This will...
It is still not too late to buy Lean Hogs. RSI is showing overbought conditions but there are no reversal patterns on the daily chart.
Zip started its short term trend reversal and appears to be bullish again. This would be the long term trend if Zip can break the minor downtrend resistance again. Investors can buy at this price for minimum drawdown and maximum profit. Another profit taking will happen at the previous all-time high value so better to sell at that point.
Corn looks very bullish to me. Corn has large gaps between support/resistance levels. That means when the price moves it moves fast. Corn price has broken two resistance levels and broken out of a symmetric triangle to continue the bullish momentum. The large time gap between the previous high and the breakout could mean that Corn could move to the next...
I just noticed that when the VIX index is traded on the 14th day of the month, if you open a long position near the close value you are almost guaranteed a very nice risk-reward ratio with a minimum drawdown. When VIX is not traded on 14th, this can happen on the 15th or 16th.
Coffee is forming a descending triangle in the daily/4h chart. Also, the price is at a major support/resistance level. There will be a retest at 130-131 level. If rejected again, most likely the price will fall down to the 115 level in the short-mid term. There is a good support level in the weekly chart, most probably this will hold and coffee could become...
Gold is clearly doing a channel down to get rid of the unhealthy belly it has accumulated during the past few years (especially during the lockdown). Do not expect a reversal soon. There are no indicators of a price reversal yet. Instead of battling the Bear, ride the channel down. Buy when it touches lower bound and sell when the price bounces back. Do not hold...
Gold was at its highest in Aug 2020 and started a downward channel. Gold did two retests at $1960 and failed. Price fell up to $1676 until it finds a strong support level. For the first time in 7 months, Gold shows us a double bottom pattern in the daily chart. The price did not close below the bullish support line coming from 2019-2020. If bullish support...
Let's go back a decade and observe how the VIX index played out the 2007-2008 financial crisis and the market's recovery. Previous to July 2007, the highest VIX value was $22.58 observed in June 2006 (minuscule compared to what comes next). Then the crisis happened, and VIX became extremely volatile and created a new support level at $16.7. There is various...
During the past month, Oil reached a significant resistance level of $67. As someone should expect the price fell back sharply to $63 and to $58 within two weeks of time. Then the price started rising again and finally at $61 level. Oil has to pass two significant resistance levels to continue the bullish trend. The first is at $62 and the second one is around...
4000 is an interesting number for Europe 50 index. This is the value that acted as resistance in July 2007 which reversed around 80% of upward movement. Also, this was the highest point before the 2008 market crash. Europe 50 is increasing at an increasingly fast rate near a powerful resistance which could only be explained by one scenario. The market could very...
The gasoline market is huge and primarily depends on the Oil market which is even larger. When a big market shows a very high momentum most likely it is driven by speculations instead of real demand/supply based on usage (when things are normal). We can see a sharp price increase from March 2020. The price has faced only one major correction, and the rate looks...
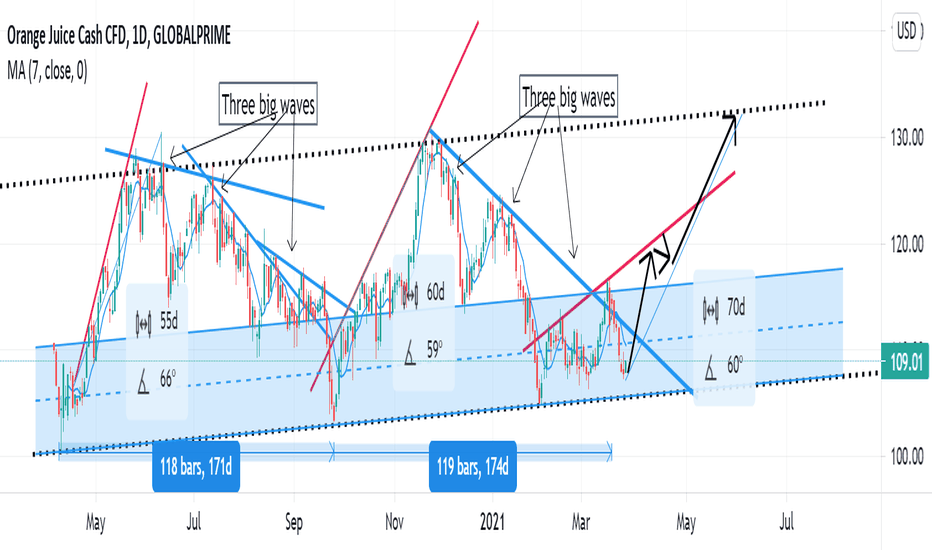
Orange Juice demand/supply cycle frequency appears to be 170 days. Close to 25 weeks or 6 months. When the price falls down, they come in three big waves. But the price increase happens fast. It takes about 2 months to increase the price to the maximum level. Price falling happens slowly, takes about 4 months. The last bull run in March couldn't break the...
Based on trend lines and support alone Platinum looks bullish. However, there is a triangle/ pennant forming therefore need to test if the bottom support holding up (or check if it forms a descending triangle ). Most likely it will retest the previous high, fall back. If trendline support holds up, it should nicely go up. This is just a trading idea, not a piece...


