tom_mok
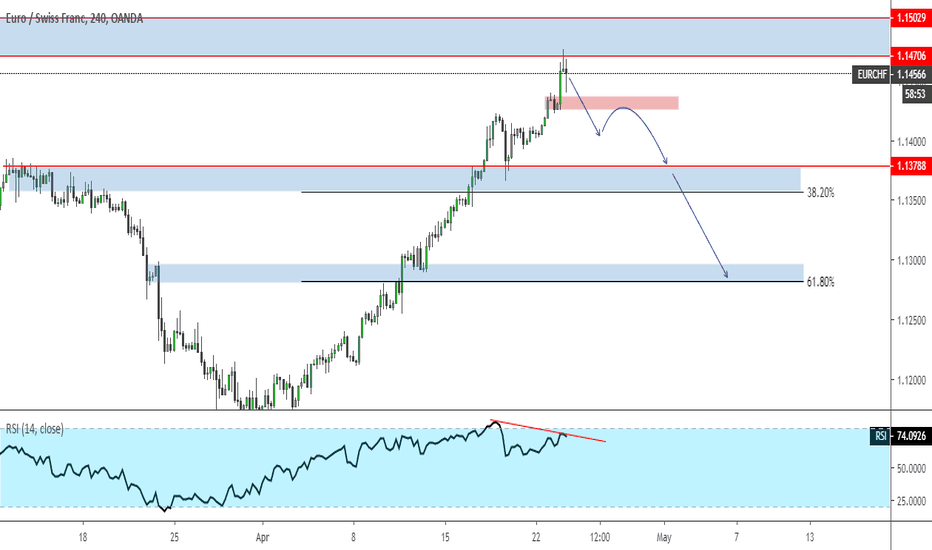
Modprice touched resistance level and we look for weakening of CAD. Short setup as on the chart we have bearish divergent as well
price potentially create cypher pattern. some upside movement may occur to complete the pattern. on complete pattern, we can try to short it again
Price break minor resistance and potentially tag the top again. buy on pullback to blue area or 61.8 using 2618 trade setup TP1 on the previous high. SL below double bottom
after a double bottom, Price break the wedge and has potential to tag the top again. find pullback to buy. watch the previous high resistance for profit taking area
complete bullish butterfly for a reversal. find minor pullback on smaller timeframe to get best price
After break trendline, currently price pullback and retesting 61.8 buy setup following the arrow or if price complete the bullish cypher
Price potentially create double patterns. so we can try to buy to complete the pattern. If patterns really created, we can consider to sell it again
price bounce from support area after completing ABCD pattern. and potentially create cypher pattern. buy on pullback to red area
on the daily chart we can see price touch support line and bounce so we can try to buy based on this setup. price create small double bottom, we can buy when price pullback to red area or 61.8 level using 2618 trade setup we have bullish divergent as well
on daily chart price retesting support level and bounce. stochastic hidden bullish divergent. on H4 we have transition for continuation and bullish divergent on RSI
Price complete AB=CD Pattern and reverse. wait price pullback to blue area which is potential right shoulder. target 38.2 dan 61.8 SL above D point
Price complete bullish gartley on potential right shoulders. SL around 30 pips. target on chart
two days ago price move quite strong to the upside, but yesterday we can see some seller pressure and created Pinbar with the formation of this pinbar we will try to sell when the price pulls back to 50-61.8 levels if the price pulls back to the area, the price will also retesting the structure area. RR on chart
after some sideways movement on H4, we can see price breakout the resistance. but in the weekly chart, price still cannot close above the resistance this will give us short opportunity, sell when price pullback to blue area. SL will be above the previous high. target on chart
Price complete AB=CD Pattern and we can take speculative buy. Reduce lot size RR on chart
On the daily chart we can see price reached supply area on the lower timeframe we have bearish divergent and we look for sell. wait until break red area before sell on pullback
in the previous idea, we have reached the target profit for ABCD Pattern completion. Now we have buy opportunity as price touch the support level setup transition :
Price break wedge, and this give us opportunity to short. targeting complete AB=CD pattern. sell on pullback for the best entry


