traderxchart
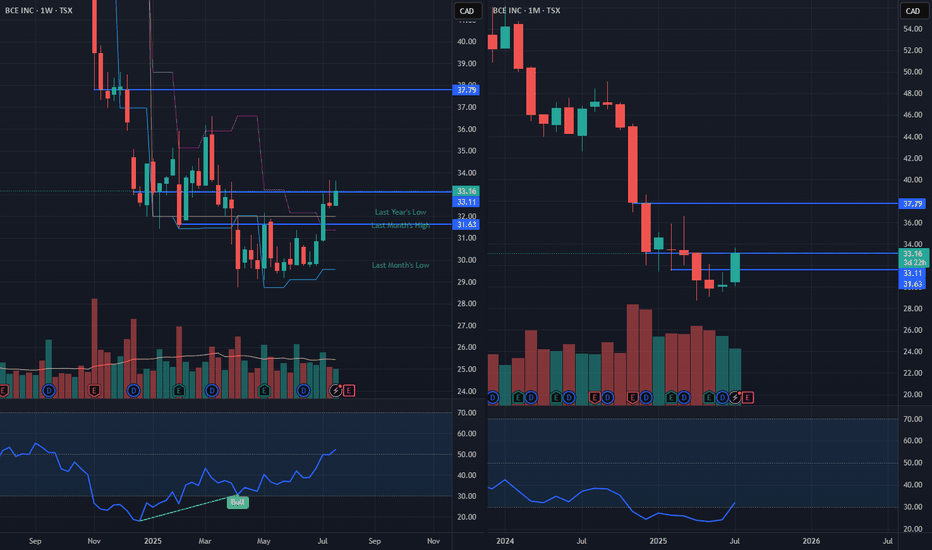
PremiumBCE monthly is oversold, a rare occasion to potentially load up and sell when the monthly RSI hits 70. Monthly volume is not as big as the 2000-2010 period, however it does match the volume from 2021-2022 highs suggesting this may be the bottom. Weak red monthly candles followed by June's reversal candle also suggest accumulation. The weekly support around 29...
Presetly: seeing a weekly bear flag spotted on oil Expecting: next weekly candle to be continuation red candle
Bearish case Monthly RSI at 91 Weekly candles encountering resistance Daily candles under the 20 day SMA Bullish case Monthly candle not a clear bearish candle, no monthly volume spike or no monthly RSI double top like SMCI and no bearish divergence detected yet. Weekly no continuation down after first 2 red weekly candles Daily volume spike suggest temp...
LMT Monthly Monthly reversal candle with volume spike at the support trendline Bulls need to May monthly close above last month high Weekly VRVP indicate accumulation at the support trendline Weekly bullish divergence Conclusion Good R/R for a swing
Daily Rejection at the psychological 3500 level Bulls need to hold 3200 level (previous volume spike) Weekly Bulls need a higher weekly low Monthly Monthly RSI super high Bulls May monthly high Bears need a lower high Conclusion Stay in cash
Monthly VRVP indicate huge multiyear volume accumulation Need to close monthly May candle above last month's high Weekly Expecting green continuation candles (good thing that each weekly candle is making a higher high each) as low is probably in with that weekly reversal candle and volume spike Medium term target 200 300 in the cards along with monthly target...
Oil Monthly Monthly continuation down Psychological support level 50 Strong 43.5 level Weekly Expecting weekly continuation down R/R high as price is really close to 55 last's month low level Conclusion Not a good trade setup However long term is down maybe all the way to weekly or monthly RSI 30
XLE Weekly Volume spike + Reversal Candle Continuation candle didn't break the high of the reversal candle's high Last weekly candle is week Most probable scenario is a test of the 74.5 weekly low level Daily Bear flag with 20 daily EMA acting as resistance Momentum bearish: High US interest rates slow economy Trade war
Recap: 1. Weekly RSI 30 2. Weekly bullish engulfing 3. S&P successfully defended oct 2022 trendline Now: Monthly hammer candle Next potential scenario: 20500 level could be the neckline/resistance level for a inverse head and shoulder, coinciding with the 20 weekly SMA as of now. Next probable scenario: Expecting May monthly candle to be a continuation green...
S&P successfully defended the Oct 2022 trendline Weekly RSI oversold at 30 Bearish case Nasdaq still under the Oct 2022 trendline
Draw the trendline from all lows/bottoms since 2022 and you'll notice Nasdaq is now sitting right at the support trendline with a daily hammer candle sitting right on it. XLF filled the gap so another hint that this may be the bottom. Hold long swings and re-evaluate at every weekly closed candle.
Oil broke an import support trendline yesterday at tariff confirmations. Weak energy demands typically means a recession is near.
Expecting next daily candle on Monday to be a green candle.
Daily hammer candle on Friday indicate potential temporary bottom. Typically, a position would be open on late Friday before close to capitalize on potential second green daily candle. Personally would only hold trade 1 day and close it on high of the day of next Monday since there's no sign of reversal on the weekly and monthly. Or hold it till it reaches a...
NOC weekly hammer candle Daily volume spikes at low red candles Daily oversold. Trade held over next week Feb 28. Expecting green weekly continuation or else trade is cancelled.
Daily RSI reached 30 Volume spike previous day Expecting weekly candle to touch 4 weekly MA Expecting daily gap fill Support at yesterday's low Counter-arguments No daily bullish divergence spotted
Clearly a bull flag Candle under the 20 day SMA might be the short squeeze
Canadian HEU is rejecting daily resistance trendline despite OIL rallying today and American energy companies performing green today May have to do with tariff threats. Ticker: HED for shorting HEU


