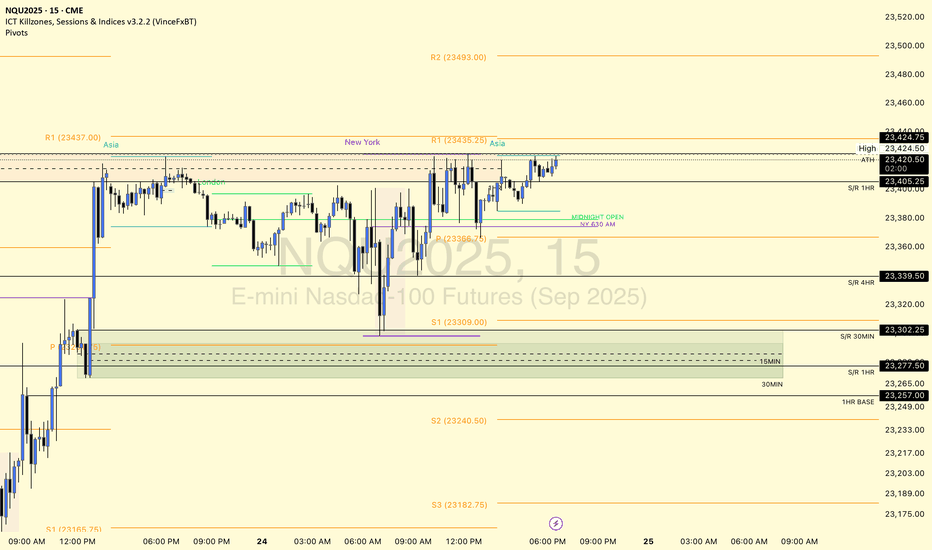
www.tradingview.com This is SEED_ALEXDRAYM_SHORTINTEREST2:NQ chart for my YouTube community. Intrigued to see if we sweep for a new ATH or a rejection to test demand levels below. With a new ATH, gotta wait for more S/D S/R levels to be created. Will resort to imbalance playbook or S/R play until then.
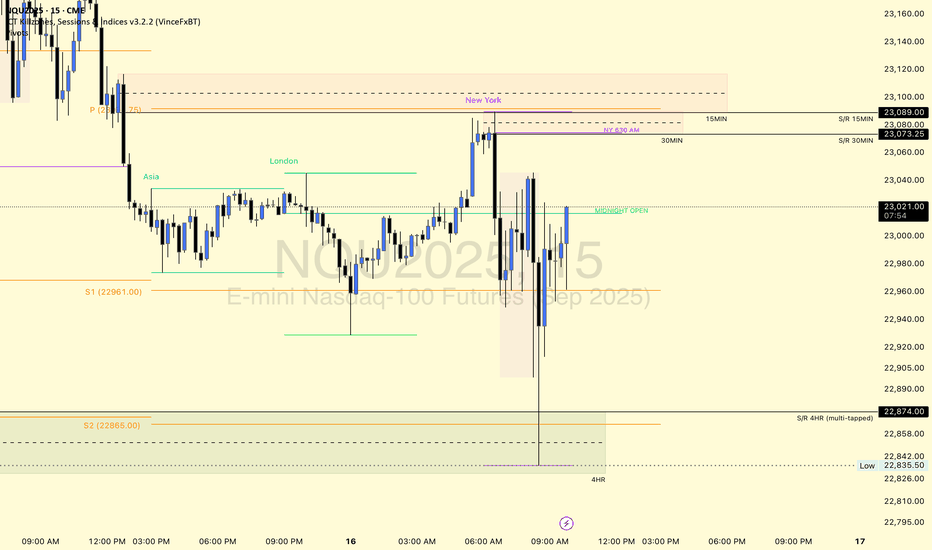
www.tradingview.com This SEED_ALEXDRAYM_SHORTINTEREST2:NQ chart is posted for my YouTube community. The 1HR S/R level is holding price down well for now and we have tapped into the 4HR supply 2x so far. We have built up support that can use as potential bounce levels if* respected, but price needs to reclaim the S/R level and show higher lows. If not, a...
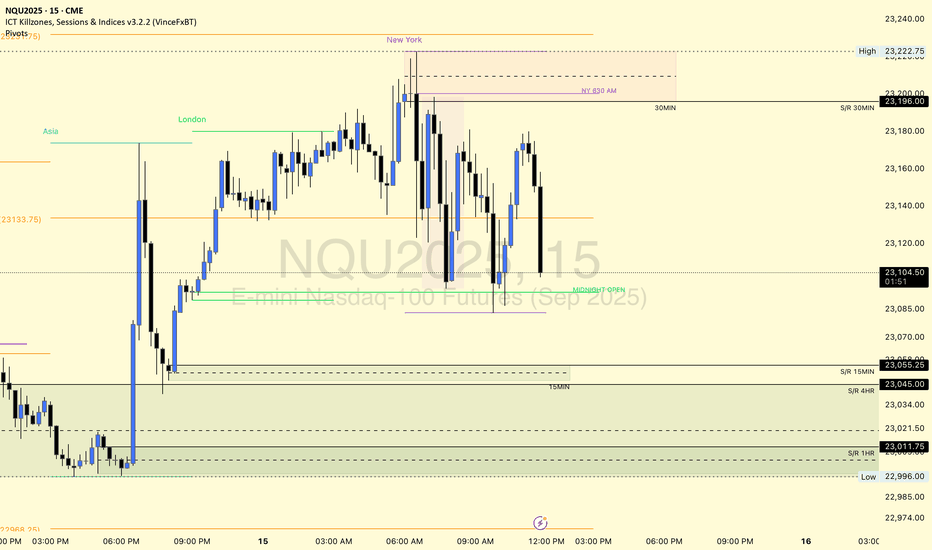
This chart is for SEED_ALEXDRAYM_SHORTINTEREST2:NQ posting for the YT community. www.tradingview.com We are building more levels although we have approached and created a new ATH. Would love to see a retest of the levels below, especially with the momentum of leaving some levels untested and untouched. We have the 50% mark at 23310 that has been left and is...
This is for SEED_ALEXDRAYM_SHORTINTEREST2:NQ chart only, not as many supply zones with the limited timeframes I can use for TradingView free plan. This is my chart coming into next week. However, we have so far found rejection from new ATH and making our way to retest the imbalances and previous resistance-now support levels of past supply zones.
This chart is for SEED_ALEXDRAYM_SHORTINTEREST2:NQ only. We recently hit ATH this AM session and now price is accumulating and we are waiting to see what it wants to do next. Continue to hold support at ATH before we breakout higher, or break below and close below ATH support for a retest lower?
This is for SEED_ALEXDRAYM_SHORTINTEREST2:NQ chart specifically. Posting for the YouTube fam and to hold myself accountable. We broke through many demand zones after failing to break newer highs and the 2 news releases.
This for sharing my S/D zones for SEED_ALEXDRAYM_SHORTINTEREST2:NQ specifically.
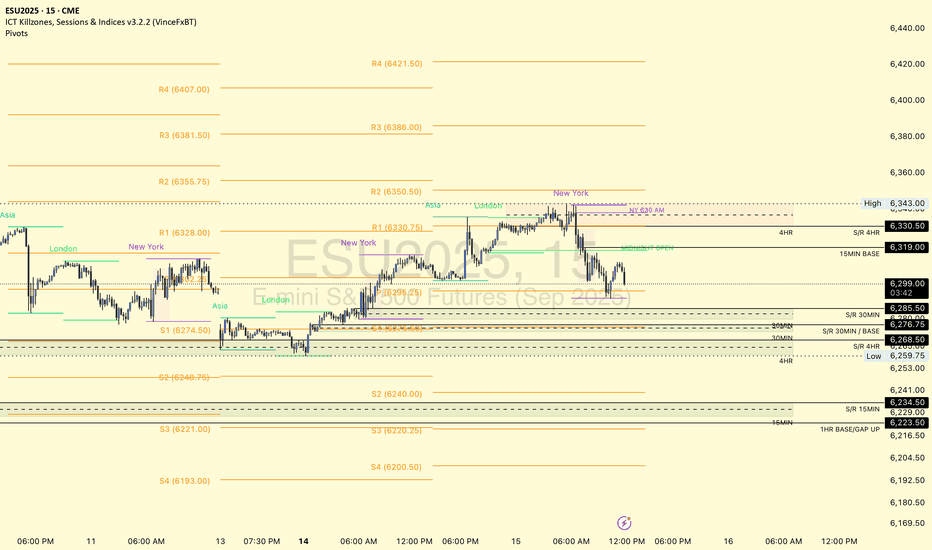
This is for posting my S/D zones for ES specifically.
Link to chart: www.tradingview.com Price is bound between the 1HR demand and supply zones. We are only a few percentages away from ATH, if we can break and hold above the strong 1HR and 4HR supply above that can be a test to go ATH. If we fail to break, then I would be interested to see a retest of the 1HR demand below that was tapped 1x earlier. I would like to...
Link to chart: www.tradingview.com Bearish: If we break Asia Highs and tap into the 15MIN Supply above (even push up to 21300), then a rejection to break lower into 30MIN demand to take PDL of NY session 5/21 and final target of 5/13 NY low at 20972.75. Bullish: If we break and hold above the 15MIN supply above (and break and retest holding over 21300 12AM...
Chart link: www.tradingview.com On the 4HR chart, price is setting up for a head and shoulders pattern, but there has been solid break and retests of past levels to allow price to move up into the Daily supply above. Given the previous news released today from Trump that there is 'talks' to get settled with Canada and China tariff prior to FOMC, I expect a large...
Link: www.tradingview.com After manyyyy months, I am finally coming back into my bread and butter.. Supply and Demand zones. Relearning this type of chart analysis was interesting, muscle memory kicked in but I definitely had to rewatch and re-read some old material to remember how I used to do this. Back to the charts, my 2 games plans are: 1. Push into 1HR...
Every single BSL has been hit, except for 1 and our ATH... Let's see how we react from FOMC tomorrow! Chart: www.tradingview.com
Link to chart:https://www.tradingview.com/chart/vYaceW5a/?symbol=CME_MINI%3ANQ1%21 As noted from yesterday's post, 4HR supply above near 4/5POC held strong as resistance.. Looking for a push lower coming into 5/8. Bears target is the 5/7 VAH where the 1HR demand level sits and pivot However, with strong enough momentum a squeeze to 18144-130 looks good where...
Link to chart: www.tradingview.com Incorporating volume profiles from multiple TF (session vol. profile) to find previous day's VAH/VAL/POC and how we can potentially react off of them. With S/D zones, it can show as support/resistance for certain levels and aligning pivot points as 3rd confluence for potential influence of strong priced levels. Still working in...
Chart link: www.tradingview.com Love the strong push into overnight session, as we are now sitting in a 1HR Supply. I am keen to see this break to either pivot point R2 (bullish) or R1 (bearish). If we can keep struggling in this zone, I want to see a pull down to retrace the huge drop we faced prior to earnings. There is a long wick off support so the pressure...
Hitting uncharted territory is scary as we don't know the ceiling of this train. Idea: push into ATHs (pink line) for a stretch into R1 920s area. If flow and momentum is bulls strong, pullback into 890s and then continue higher. If bears strong, push into 890s for consolidation, before move into lower demand 30m/1hr zone 812s. First day back into charting after...
Link to chart: www.tradingview.com Lots of HTF (higher time frame) zones to look out for. Strong bullish move from 14000s to 15000 in a few days. News events this week are potentially moving the market AND hitting a key support zone within the last week. If we can push in the upper 4hr supply above 15040 or so, it would be nice to break out of the 4HR...


