trushkovskiy
PremiumRight now, 4th of April I'm standing in APPLE STORE THE GROVE LOS ANGELES and I'm telling you - the price will turn around ASAP! That's not financial advice
🚨 SOMETHING BIG IS COMING TO THE CRYPTO MARKET 🚨 Two massive bearish divergences flashing on the HIGHER TIMEFRAMES: 🟥 WEEKLY 🟥 MONTHLY This is NOT just noise. These divergences don’t show up for fun — they often precede violent corrections. We might be standing right in front of a major crash. Maybe not from today, but August could be the breaking...
THE FULL PICTURE: WHAT’S NEXT FOR BITCOIN, ALTS & VOLATILITY? May 11 – June 7 If we connect all the dots — Bitcoin price action, volatility spikes, altcoin rotation, the DXY (dollar index) behavior, and USDT dominance — here’s what the next few weeks really look like: ⸻ May 11–14 Silence before the storm Bitcoin slightly goes up Target zone: $105K –...
🌟 GOLD: THE BIGGEST TRADE OF SUMMER 2025 XAU/USD Forecast 📈 PHASE 1: SHORT-TERM RALLY (after small correction to 3172$) We expect a bounce toward the $3,789–$3,800 resistance zone. 🔴 PHASE 2: THE SHAKEOUT May 27 SELL ZONE. After May 27, the cycle flips. Expect a violent correction, retracing into key support around $2,880–$2,970 or even lower. 🟢 PHASE...
🚨 BTC Roadmap — May 2025 Here’s the timeline you’ll want to pin and come back to. ⸻ 🔴 May 4–6 Low volume. No major moves expected. BTC goes DOWN and BTC dominance starts trending down, but it’s not the moment to jump in yet. Patience. 🟢 May 7–9: ALT PUMPS BTC Volume increases! BTC UP This is the first major altcoin opportunity. 🔴 May 10–13: SELL SIGNAL...
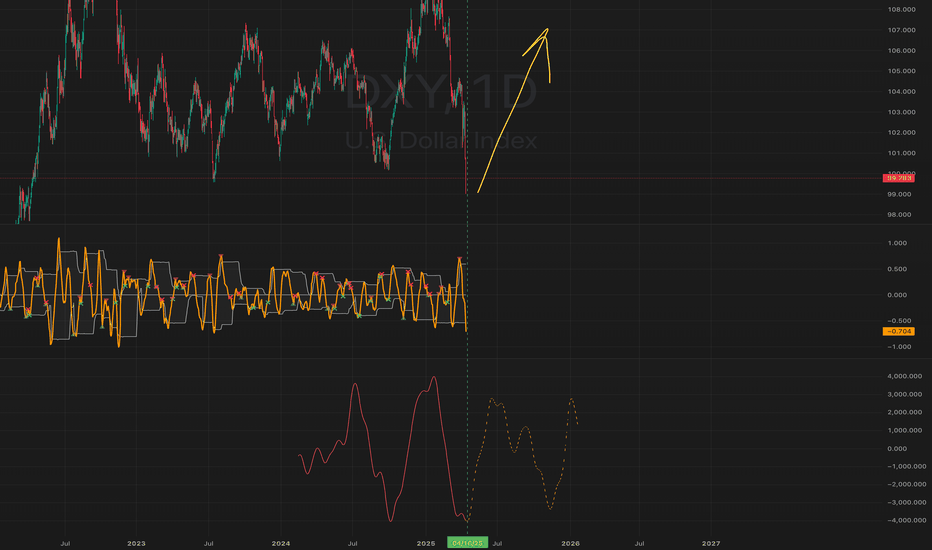
See you there, Mr.President DXY (usd) PUMP from 15-16 of April
In my opinion we will see one more crash because of MSTR or ETH SCAM (Buterin, Saylor)
🔍 SPX/USDT Analysis: Daily Timeframe 📉 SELL IT! The SPX chart on a daily timeframe highlights significant upcoming dates where price movements may present trading opportunities. These should be analyzed in conjunction with higher timeframes for a comprehensive market view. • September 3, 2024 - Red Line: This date marks a potential local peak. Traders might...
🚨 WHAT IF THE BIGGEST ECONOMIC RESET IS HAPPENING BEFORE OUR EYES? 🚨 We’ve seen governments manipulate markets before, but what if we’re witnessing the most sophisticated financial maneuver in history? Right now, the U.S. is drowning in historic levels of debt—over $35 trillion—with interest payments soaring to nearly $1 trillion per year. The system is...
BTC 1W prediction for the next "BULLRUN" 2025- What if? Maybe, one day...
All you need to know about next #BTC huge moves. We can see the next BULLRUN dates. The highest points of BITCOIN in this market 2024/2026 and 2028th years
Just remember to buy CRYPTOCAP:BTC on this dates and SELL at the end of MARCH!
This is our forecast for BTC on 4h timeframe! You should know that
BTC price forecast this is not financial advice but! who knows....
So the end of BTC will be at the end of January 2025 The end of CRYPTO BULL RUN will be between MARCH - JULY 2025 The best dates for ALL IN will be on the GREEN LINE, but you better wait for update before buying
BTC 1W long term forecast with our prediction model! This is not financial advice
TON/USDT Analysis: 4-Hour Timeframe 📊 The chart displays Toncoin’s performance against USDT on a 4-hour timeframe, highlighting important dates for potential price movements. 🟢 September 26, 2024 - Buy Date (Green Line): This date signals a potential local bottom for TON, indicating a possible buying opportunity before an expected price increase. 🟢 September...
AEVO/USDT Analysis: 4-Hour Timeframe 📊 The chart displays AEVO’s performance against USDT on a 4-hour timeframe, marking key dates for potential price movements. 🟢 BUY NOW 🔴 September 26, 2024 - Sell Date (Red Line): This date indicates a potential local top for AEVO, signaling an opportunity to take profits or close long positions before a possible downward...


