tux
Current Price: $9.45 Date of Analysis: June 14th, 2024 Time Frame: Weekly Chart Observations: Moving Averages: EMA 20 (Close): $5.62 - The stock is trading above the 20-week exponential moving average (EMA), indicating a bullish trend in the short term. EMA 50 (Close): $4.68 - The stock is also well above the 50-week EMA, reinforcing the strength of...
Current Price: $70.27 Date of Analysis: June 13th 2024 Time Frame: Weekly Chart Observations: Moving Averages: EMA 20 (Close): $62.99 - The stock is trading above the 20-week exponential moving average (EMA), indicating a bullish trend in the short term. EMA 50 (Close): $58.90 - The stock is also well above the 50-week EMA, reinforcing the strength...
Current Price: $10.53 Analysis Date: 6-8-24 Chart Timeframe: Daily Iris Energy Limited (IREN) exhibits a robust upward trajectory, supported by a series of technical indicators that underscore a strong bullish momentum. Recent price action has convincingly breached previous resistance levels, suggesting potential for further appreciation. This analysis provides...
I use machine learning and with technical analysis to determine stop, and take profit levels. SL: 0.56163471 TP1: 1.20926020 TP2: 1.73273395
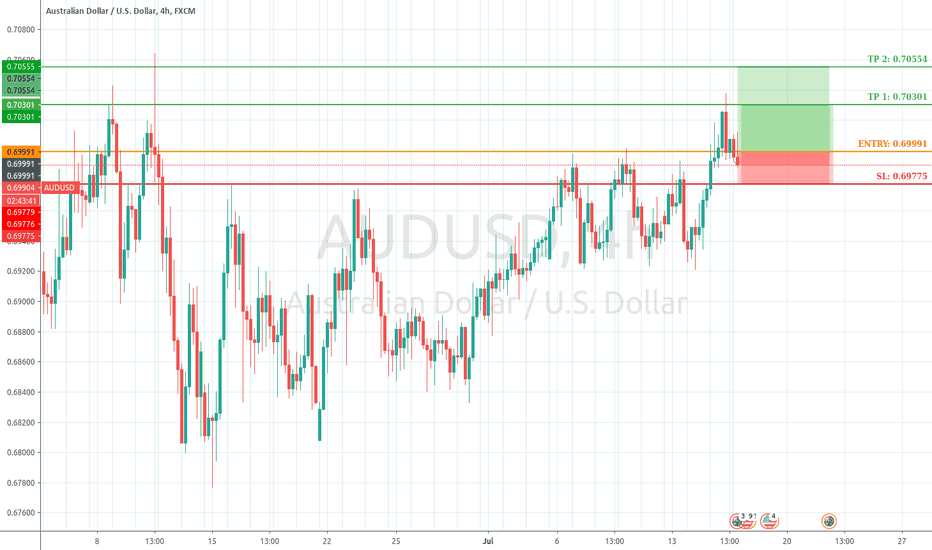
I use machine learning and other statistical techniques to determine entry, take profit, and stop-loss levels. Position: Long Entry: 0.69991 TP 1: 0.70301 TP 2 : 0.70554 SL: 0.69775
SL: 0.69313 TP: 0.68766 ENTRY: 0.69086 From my analysis, NZD/USD will drop to 0.68766. I use machine learning and data analysis to determine these levels.
I use machine learning and statistics to calculate entries, take profit, and stop loss areas. Entry: 0.73137 Take Profit: .72788 Stop Loss: .73278
I use machine learning and statistics to calculate entries, take profit, and stop loss areas. Entry: 0.72722 Take Profit: .73000 Stop Loss: .72625
I use machine learning as well as several other techniques to determine my entry, take profit, and stop loss. Entry: 0.72533 Take Profit: 0.71059 Stop Loss: 0.73399
Hitting resistance area for daily MA. TP: 0.71991 SL: 0.72651
Entry: 0.72009 TP 1: 0.72097 TP 2: 0.72210 TP 3: 0.72453 SL: 0.71885
Divergence on the MACD near support area on the hourly chart.
I use machine learning and other techniques to help determine these prices predictions. Entry: 0.73254 Take Profit: 0.73844 Stop Loss: 0.73042
M30 Close: 0.72259 H1 Close: 0.72310 H4 Close: 0.72158 H12 Close: 0.72135 Daily Close: 0.71690
I use machine learning / custom scripts to determine my positions. TP: 1.10409 SL: 1.10889
I use machine learning / custom scripts to determine my positions. TP: 0.74001 SL: 0.74481


