vs_sayin
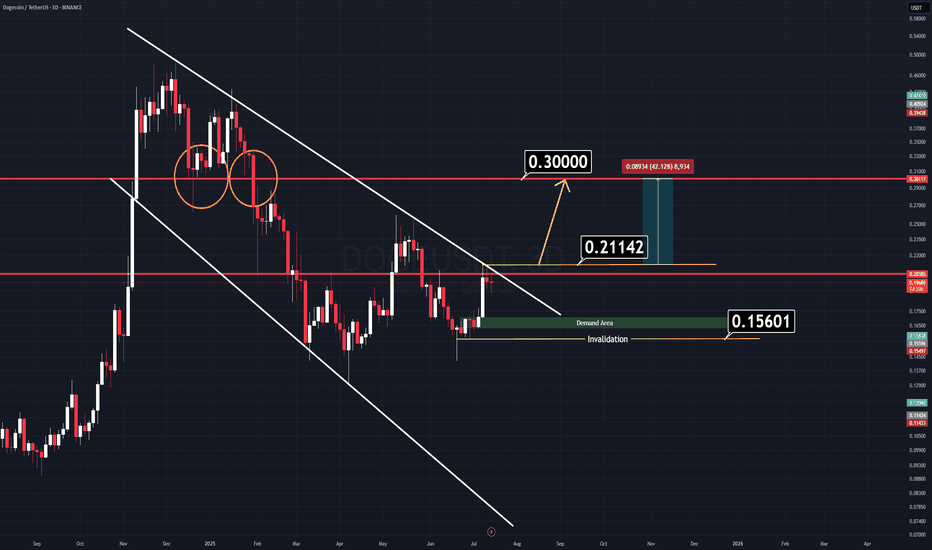
PremiumThere’s a very simple and clear chart setup on Dogecoin (DOGE) right now. We have two major horizontal key levels and a channel that is about to break down. If the price manages to close above the yellow-marked line ($0.21142), we can expect a strong rally to follow. There’s no need for complicated indicators cluttering the screen — all relevant levels are...
The TOTAL3 chart is currently retesting a key diagonal trendline that was broken previously. This is a classic bullish retest scenario. If the current daily candle closes green, and is followed by a strong impulsive candle without invalidation, it could signal the start of a new leg upward, right from this zone. The $900B market cap level remains the key...
Bitcoin is currently trading in a very specific zone that resembles a classic bull flag continuation pattern, similar to the one we saw during last year’s rally. Back then, a slow-forming bull flag broke to the upside, pushed to new all-time highs, and then retested the top of the same flag before continuing higher. Now, we are witnessing a similar setup, but...
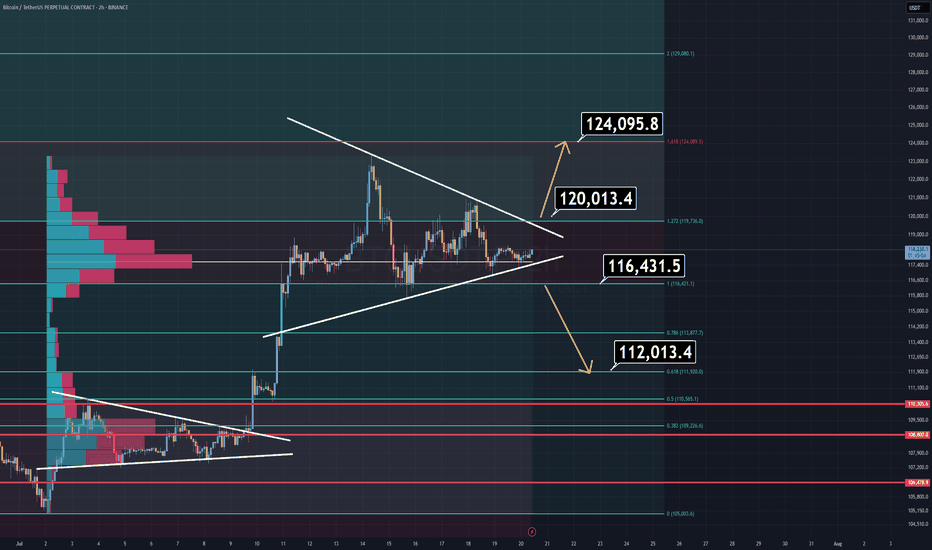
Bitcoin is currently consolidating within a symmetrical triangle, suggesting indecision in the market. However, a breakout is imminent — and when it comes, it will likely be sharp. 🔹 Bullish Scenario: A breakout above $120K would likely lead to a new All-Time High near $124K. 🔹 Bearish Scenario: A breakdown below $116,400 opens the door for a quick drop toward...
UNI – Correction Might Bring Opportunity Currently, UNI is forming an A–B–C corrective pattern, and based on technical structure, this correction may complete around the $8.8 level. Key Zone to Watch: $9.0 – $8.5 There's a strong demand zone just below $9, supported by historical price action. On the daily time frame, a broken cup & handle formation aligns...
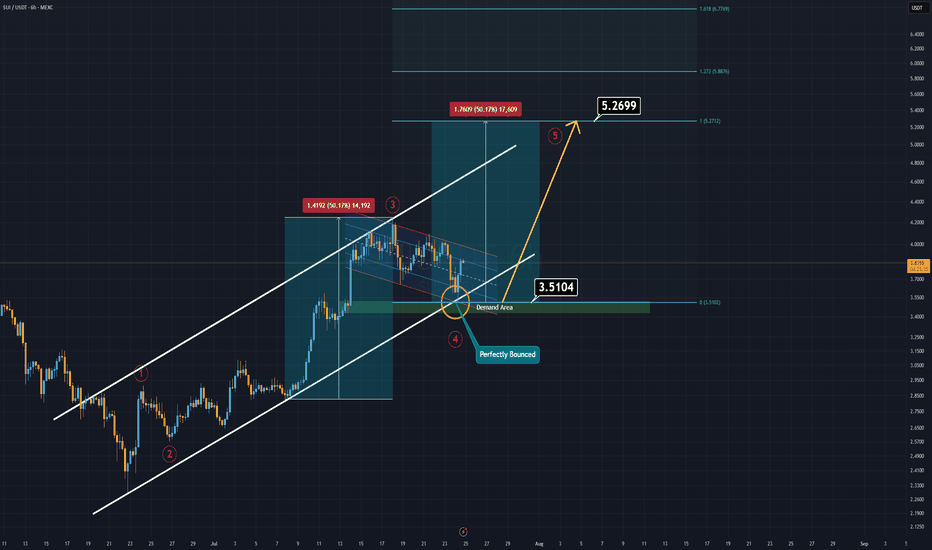
If you're on the hunt for extreme risks and potentially high rewards — SUI might be calling your name. Currently, SUI is trending within a well-respected ascending channel, and just today, it tapped both the demand zone and the lower boundary of this channel. That’s what we call a double support, and it often signals a strong potential bounce. SUI now appears...
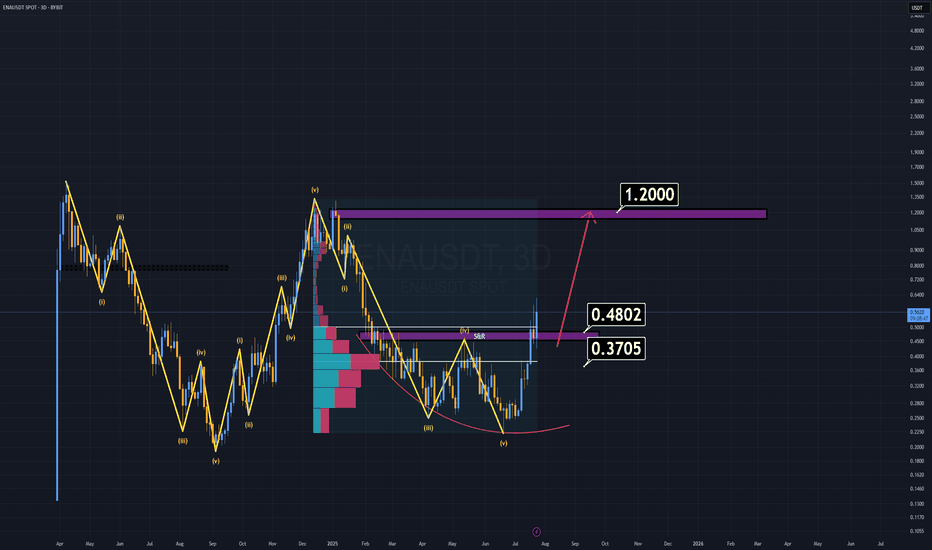
ENA has been outperforming many altcoins for weeks, yet it still appears undervalued based on its fundamentals and recent investor interest. Where to buy? Right now, buying at current levels is extremely risky, as the ideal buy-back zones are significantly below the market price. First major support: $0.48 — considered a "cheap" entry. Dream entry (low...
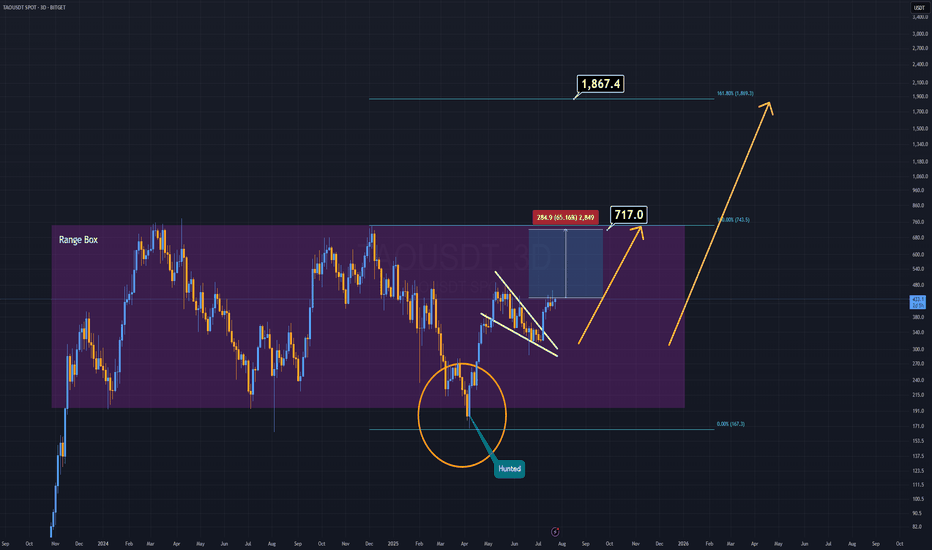
Sometimes, there's no need for complex patterns or heavy indicators — and TAO is a perfect example of that. For years, TAO has been consolidating inside a clearly defined accumulation box. Before the current bullish breakout, it liquidated all weak hands by sweeping the lows — convincing many that the project was dead. Now, on the daily timeframe, we’re seeing a...
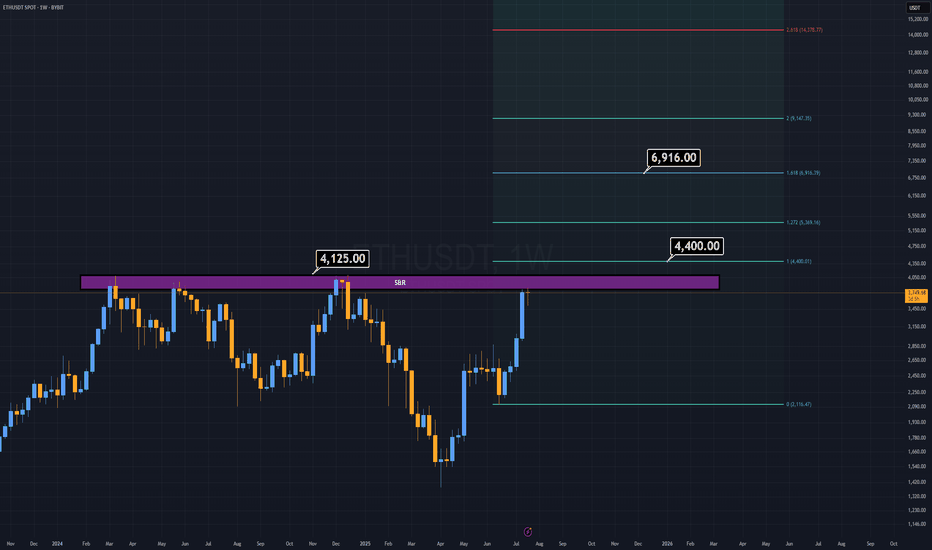
Here I am, presenting the asset I personally dislike the most — ETH. But the chart doesn’t care about feelings. ETH looks ultra bullish, but only if it breaks above the $4,125 level. Why this level? The $3,800–$4,100 range has historically acted as a major distribution zone — a place where market participants have consistently taken profit for years. If this...
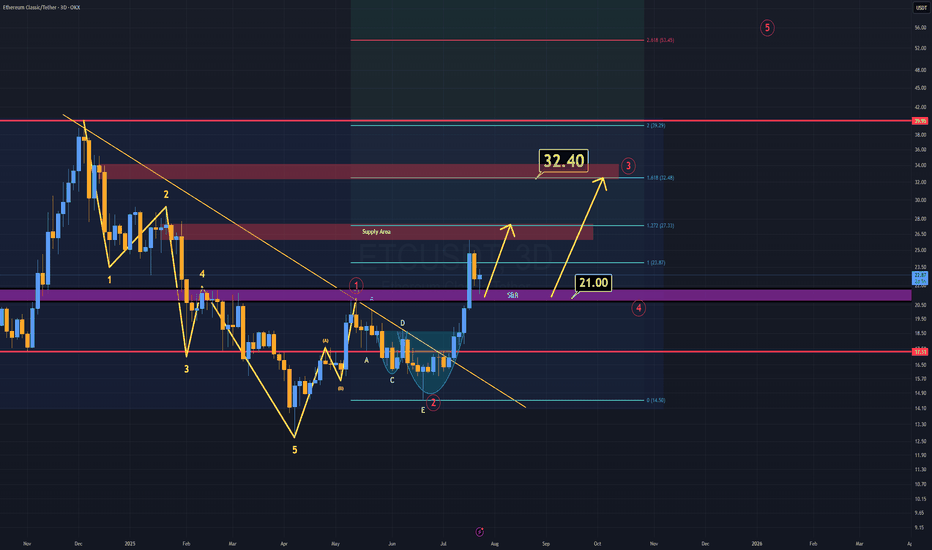
ETC is showing a strong bullish structure, just like many other altcoins. The key difference? ETC has already confirmed its breakout. As long as ETC holds above the $21 level, I believe the minimum target sits at $32 in the coming weeks. According to Elliott Wave Theory, that $32 region also marks the end of wave 3, which perfectly aligns with a daily supply...
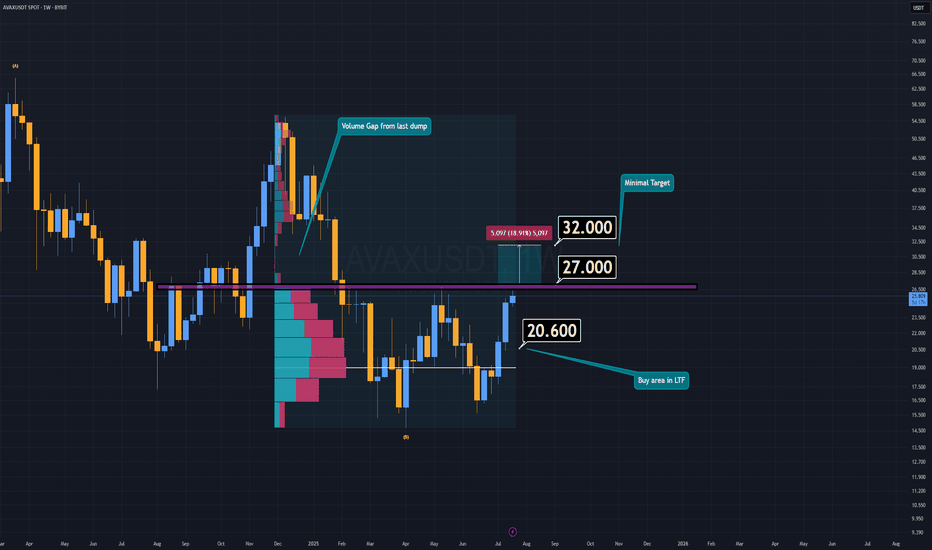
AVAX is currently attempting to form a double bottom pattern, which could signal a strong bullish reversal if confirmed. Earlier this week, AVAX made an effort to break down the key support/resistance zone, but it lacked the necessary volume to succeed. If AVAX manages to reclaim the resistance area around $27 or higher, and confirms the breakout with a daily...
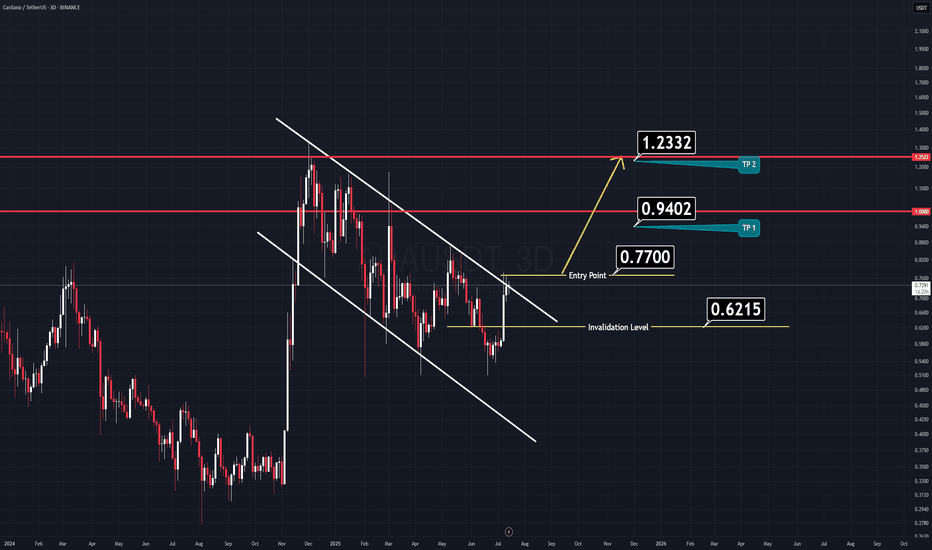
Here’s another clean and straightforward chart, this time on Cardano (ADA). ADA has formed a large flag pattern, which looks poised for a breakout soon. Just like the previous setup, nothing complicated here. ✅ Entry Idea: Consider entering when the price breaks above the previous daily candle’s high. All the key levels are already marked on the chart for easy...
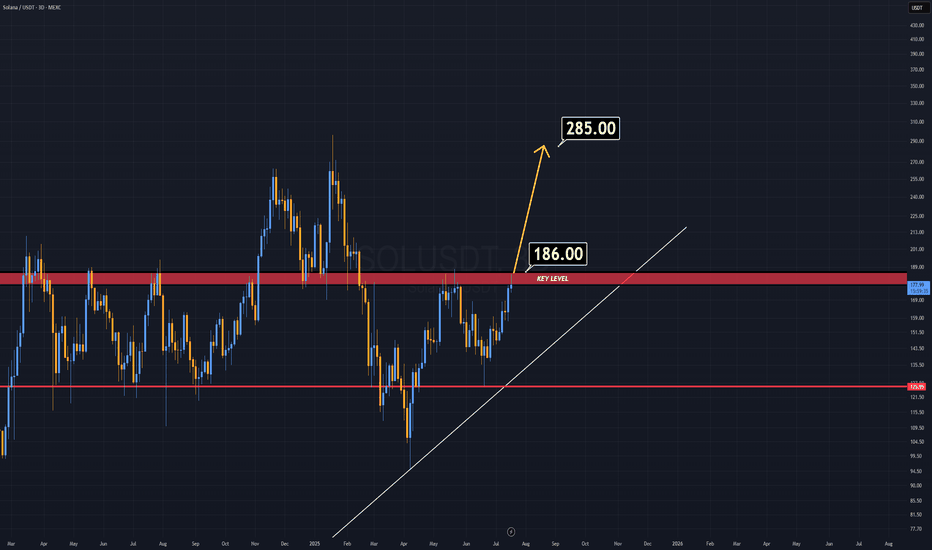
There is no need to explain why if you are in this market for a while. A weekly candle close above $186 will ignite a rally on SOL. The important key word in here is "weekly" , not "daily" . Good Luck.
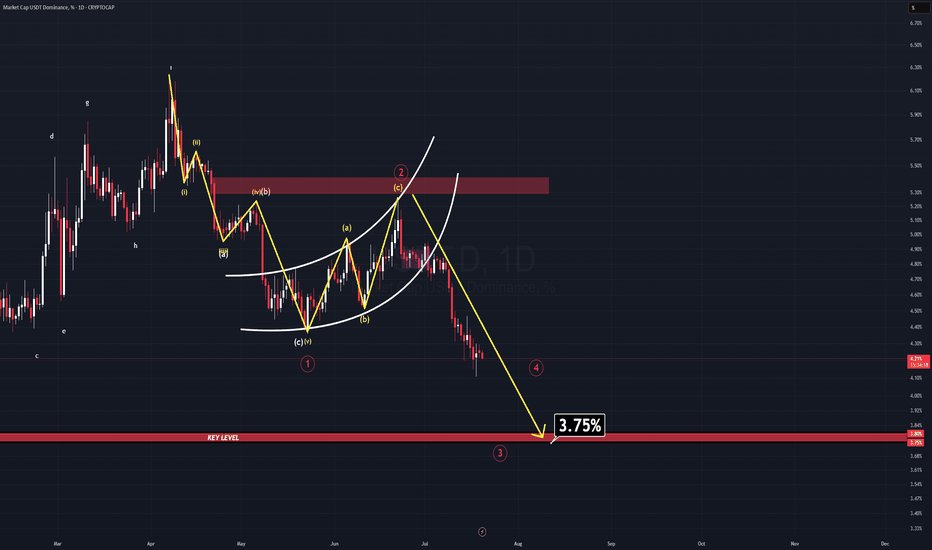
In a previous analysis, I mentioned that the long-term outlook for this parameter (USDT.D) remains extremely bearish. At the time, a bear flag was clearly visible—but it hadn’t been broken yet. Well, now it has. The breakdown confirms the bearish continuation, and there’s still more room to fall. As USDT.D continues to descend towards the projected target for...
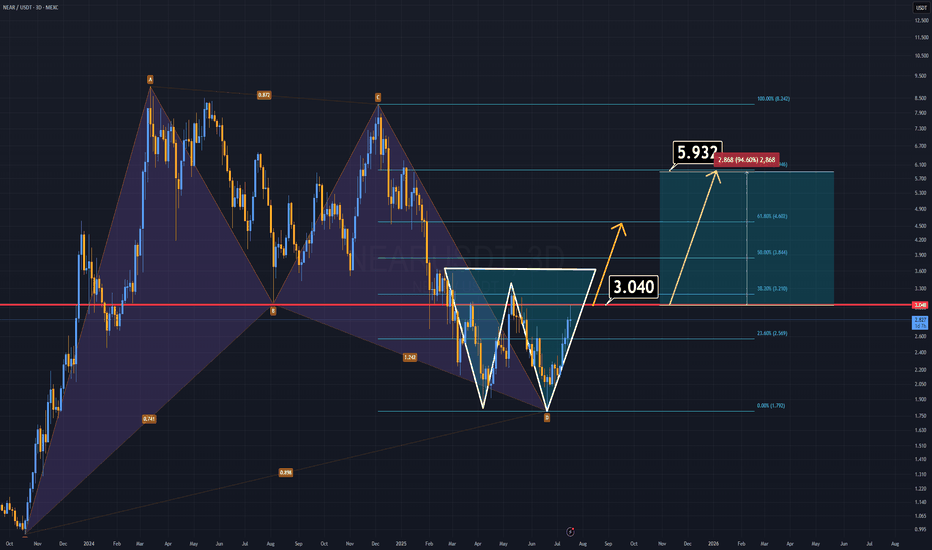
NEAR Protocol has formed two strong bullish patterns and looks ready to climb, especially with the highly anticipated altseason on the horizon. 🔹 A harmonic structure from the previous cycle remains intact. 🔹 A double bottom formation is now clearly developing. If NEAR manages to close a daily candle above the $3 level, we could see the price double in the short...
The TOTAL2 chart — representing the altcoin market cap excluding Bitcoin — currently shows signs of weakness. A double top formation has emerged and is actively playing out. In addition, a micro trend change of character has clearly appeared, further validating short-term bearish pressure. Technical Observations: Price recently retested a broken support level...
The USDT Dominance (USDT.D) chart — often referred to as the “reverse chart of crypto” — is currently showing signs of strength. On the micro time frame, a new impulsive wave structure has emerged, and we are likely progressing through wave 3 of this formation. Wave 3 appears to be targeting the 4.88% level. A minor correction (wave 4) may follow. Ultimately,...
After counting many waves for many days, I have a senario for USDT dominance which will lead the entire market on its way. For those whose not fimiliar with this parameter, there is a very simple explanation. It's the reversed way to see the market. If this parameter drops, your alts will skyrocket and if it rises, you're gonna be crying on somebody's X post's...
