The chart posted is that of the housing Market for builders .I have what looks to be a clean wave count . And should have an upward rally back above the wave a up wave C up should get to 50% most likely . I am long in the money 2027 calls now
The chart posted is that of the SOX index NOT SMH The spirals are focused on this friday and monday Today I moved to puts in SMH I am waiting on friday to short SOXBut I have moved into puts in SMH as we hit target 288/290 Best of trades WAVETIMER
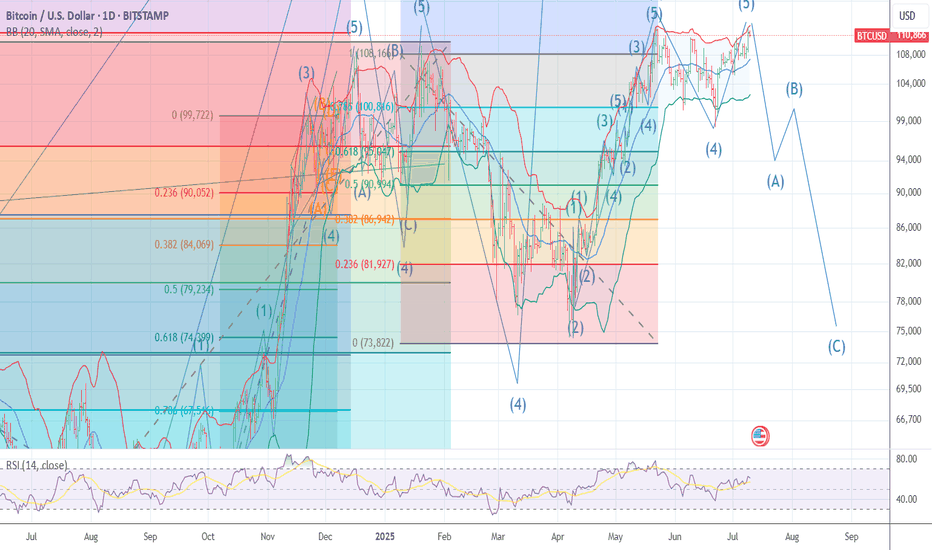
The chart of Bitcoin I DO NOT SEE 140 I see under 98 k soon into late july cycle I have NOT CHANGED THE LABEL in my EW work .best of trades WAVETIMER
The chart posted is my PUT/CALL model based on a 4 hr system I have used in the past to trigger buy and sell signals . I am now stating for the record IT IS NOW SET for and I.T. and long term SELL into the SPIRALS and VIX and BB Bands and we under GANN work I stated time n price july 5 to the 10th week 6183 to 6331 ideal target 6310 I am now 75 % long...
The chart posted is my work on the yen trade I have maintained the same labeling and as you can see What I think is rather near . I am major bearish the US stock market and I am starting to reposition for a MAJOR DOWN TURN into mid OCT the 10th best of trades WAVETIMER
The chart posted is that of the Euro as you can see the targets based on fib relationship was just seen ! I have moved LONG DXY 96.70 and will remain Long dxy until I see an ALT otherwise the DXY should rally into OCT 10th best of trades WAVETIMER
The chart posted is the updated chary for SPY SPIRAL calendar TURN Notice f12 is a spiral from July 16th 2024 top F 10 is from 11/2024 DJI The SPY was 12/5 th TOP F8 is from Feb 19th Top They ALL have a focus point on JULY 5th to 10th 2025 it is also 89 days since the print low. I Am looking for a MAJOR World event into this date . This time I feel it will be...
The chart posted is my view of the DXY I am as bullish now as I was at 71 .Best of TRADES WAVETIMER 96.70 to 97.6
The chart posted is the Yen/US$ I have NOT changed the labeling see forecast I feel something is about to Break in the markets ! best of trades WAVETIMER
The chart posted is that on the NDX 100 .This is my view of what has formed . best of trades WAVETIMER
The chart posted is that of the sp 500 and I now have counted 5 waves up as ending based on this wave structure I will look for two things to happen a rather deep ABC if there is a bull market intact and it should decline in 3 waves back to .236/382 area from 6059 - 4835 The 4th wave or A low This MUST HOLD at .382 or The cycle has ended the 5 wave sup from...
The put/call model has given a buy signal that gives me a New record highsp500 and qqq how it has formed I am long calls at 50 % and 75 short OIL today best of trades WAVETIMER
The chart posted is the sp 500 futures back in april 10 th I labeled the low at 5102 as wave B or 2 both called for sharp rally to as high as 6147 in which wave 1 or a x 1.168 = 3 or c for a wave B top . since then I saw the high at 5968 as the end of wave 3 top and then looked for a drop back to 5669 we saw 5667 and so far all rallies have taken a...
The chart is now labeled as COMPLETED . Please also take note of The HUGE difference in QQQ to QQQE and SPY to RSP . Best of trades Wavetimer 115 % short
The chart posted should be view as a guide to what is a Crossroad in all indexes Today best of trades wavetimer!
I have posted this chart a few times for a reason now based on DSI in QQQ and NDX at record highs the last three TD I thought some may want to learn > best of trades WAVETIMER
I have now started to position for the transition in the markets I have moved out of all calls again for the 4 time in 4 days each of the trades made $$ . but today is day 39 TD of the rally . And I am looking for a TOP in day 40 TD I have now moved to 40 today then 75% MOC in spy and qqq 5550 555 560 QQQ puts 2026 time zone and 650 in spy . The...
The chart posted is the USA $/YEN chart it is key to all things as to the sp 500 and debt markets A few weeks back I posted The chart of a MASSIVE HEAD N SHOULDER TOP formation !!! we are still forming the Right shoulder in a rather complex wave STRUCTURE This is the hourly model and forecast so far spot on . best of trades WAVETIMER


