xavier_fenaux
PlusShort in case of exit from the bottom of this bevel in the direction of the previous trend TP1 = 2700 TP 2 = 2600 SL = 2760 SL at Breakeven if 2700 reached
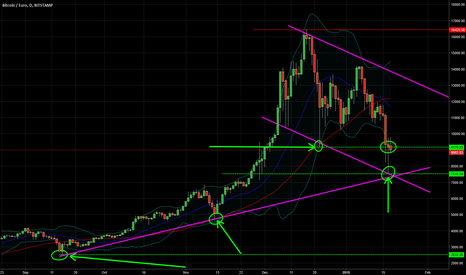
Scenario very likely of this exit from the bottom of a symmetrical triangle which follows a downward trend. Short to follow so in case of validation
After 50% of decline and that "everyone" (say we hear them when the BITCOIN loses 25% as each time) shouted at the victory of the burst of the bubble, I estimate that buyer timing is very short term for the moment, with small goals. Be careful not to be in buy and hold on the entire position, because the downside risk continues in the absence of good news on the...
Long now & Target price with the resistances in RED
TP1 = Top of Triangle (1st green line) TP2 = Report of the Triangle's base (2nd green line)
If > 300000 > breakout of this triangle + Targets price on the next resistances with principal target near the report of this triangle (arrow in purple) stop at breakeven when 4500000 reached
If > 300000 > breakout of this triangle + Targets price on the next resistances with principal target near the report of this triangle (arrow in purple) stop at breakeven when 4500000 reached
If breakout this triangle > Target price > the resistances in RED
If breakout this triangle > Target price > the resistances in RED
Long if > 0.4130 Stop loss under 0.32 TP1 = 0.50 TP2 = 0.65 Stop loss at BE if 0.45 reached
Long if > 0.4130 Stop loss under 0.32 TP1 = 0.50 TP2 = 0.65 Stop loss at BE if 0.45 reached
.... but be careful of the breakup beacause this triangle should be a continuous of the previous Trend, so Bearish. Better to buy near 33 If buy up than 140, you have to put your Stop at breakeven very fast. Targets price on the chart
IOTA could go until 0.37 $ with breakdow the 0.5070 strong level in the way of the precedent trend since august Better to buy IOTA near 0.37 $ for me....


