yoyoyo2
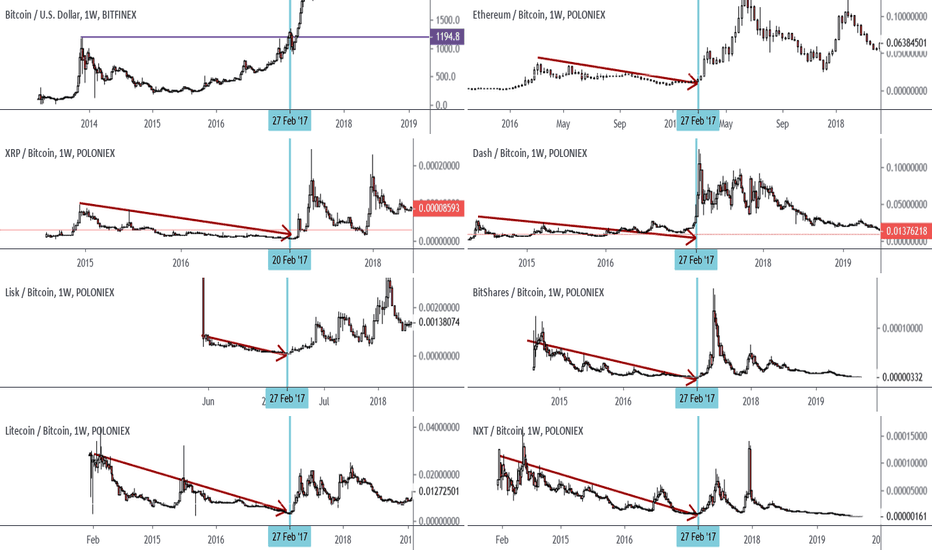
Just a comparison of the situation we saw in 2016, pretty much identical to the current one, where bitcoin was escalating to new ATH while ALTS were extremely bleeding and pessimism and bitcoinmaximalism was all around, again, pretty much like the current situation. But once bitcoin reached last ATH, situation drastically changed, and that week, the last lows were...
As simple as it gets, and as I published in my first idea a month ago, price broke below the main curve and pullbacked giving a nice short entry im still in. At the moment we have a liquidity pool resting below 9k that needs to be absorved, with a clear descending triangle pattern. Short/long positions still showing bearish vías with more than 60% of the market...
Bearish or bullish pennant, distribution or reacumulation, two main scenarios. If we are in a distribution phase a visit to the low range at 7.2-6k is on the play, if we are in a reacumulation phase, once 14k area is broken, there is no resistance at all till the ATH. In any case, we should se a weekly candle opening and closing above 12k area as a clear sign of...
61.8% correction of the entire downtrend, finding resistance at that area again as happened before in 2016, and correction of the entire rally from the lows till %50, respecting both EMA21 and 55. Enjoy the ride, next year Will be really funny.
Don't get lost in LTF charts and look at the bigger picture, simple and clear, reclaim of the blue resistance, and we Will end up seeing new ATH in ETH, sooner or later. 3 main objetives in the chart. Good luck.
As simple as it gets, the moment the curve is lost, is over for this year at least, we will revisit new lows sub 9k. Main objetives: - 8.4k - 7.2k - 6k Good luck and JUST follow the curve my Friends.


