yuchaosng
PremiumHello, in this video, I go through Gold Elliott Wave structure on a cycle level (again) before zooming in on the latest 5-waves structure that is Cycle level wave 4. I talk about using existing broken trendlines and how that allows me to determine the strength of a move when there are false breakouts, whether to the upside or the downside. Lastly, I discuss on...
In this video, I updated the wave counts for Bitcoin, primarily the change is in wave 4 where I believed that it has formed in 5-waves instead of 3-waves. Because of the new low, both our stop loss and take profit are now lowered: SL: $113,858. TP: $124,000 Good luck!
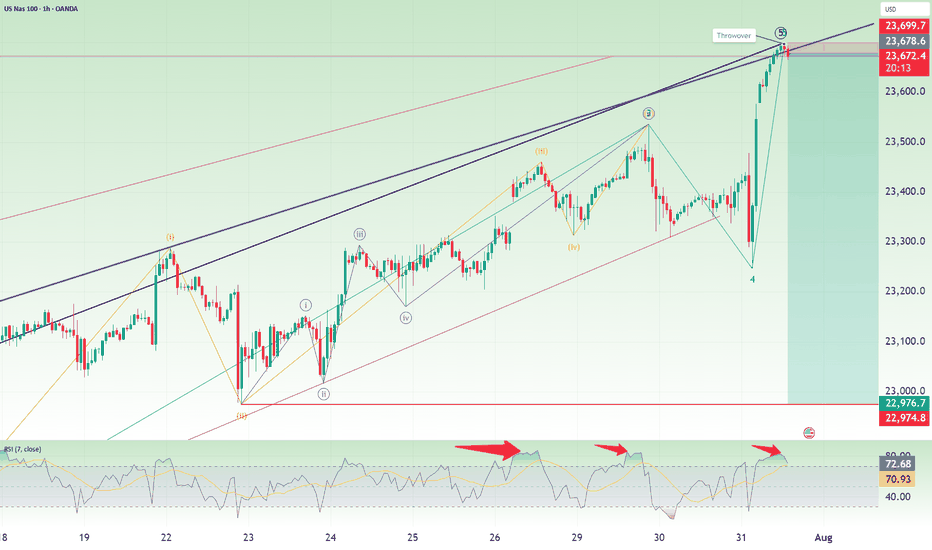
Over here, I present to you the Nasdaq short idea again. For my previous idea, it was stopped out at 23500. This time, I changed the wave counts again, mainly merging the previous wave 5 into wave 3, allowing for the new high to be a wave 5. On top of that, here are the few other reasons for the short: 1. Fibonacci extension levels: Wave 5 is slightly more than...
Hi everyone, here I am trying to catch the peak of Nasdaq again. As mentioned, the previous idea was stopped out at 23,320. Now, for this idea, I am attempting another short with a 30 points risk for Nasdaq. The stop for this idea is fixed at 23,500. The take profit is 22,650. This is a positional trade and I will re-evaluate as the waves unfolds. So the strategy...
In this video, I go through the analysis using the log chart for Ethereum and shows the potential of this cryptocurrency where I expect the price to reach new high in the coming days with a longer-term target of $6600. For shorter-term trading, I recommend placing the stop a distance below recent support on the daily chart, around $3372. Good luck!
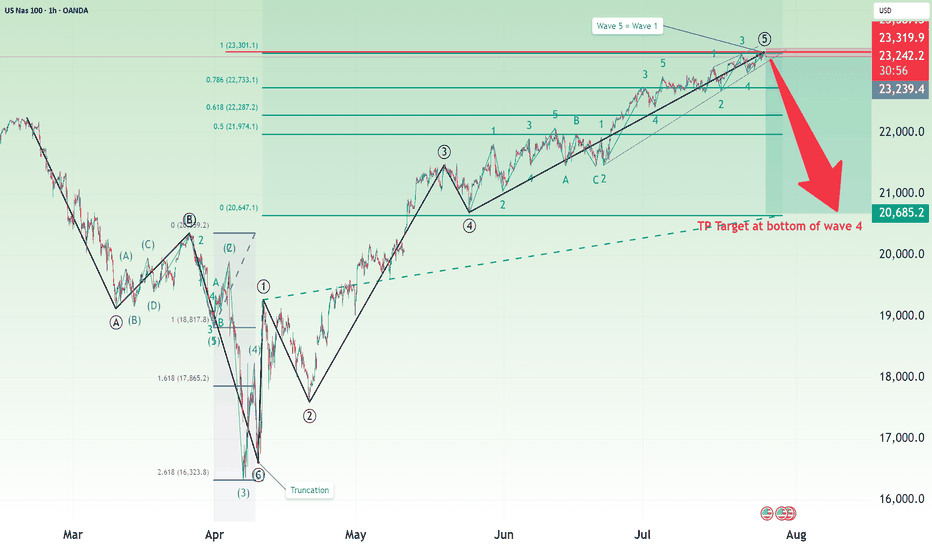
Over here, I present a short case for Nasdaq (and S&P500 by default since their correlations are high). The main reasons are: 1. Completion of 5 waves structure both on the high degree and on low degree, as shown in the chart. 2. Fibonacci measurement where wave 1 = wave 5. The stop of this idea is to be placed slightly above the high, in this case, I placed it...
I updated the Elliott Wave counts for Bitcoin and we should have completed sub-wave 4 and is currently onto sub-wave 5. Based on my counts, sub-wave 3 has extended and is slightly more than 1.618x of wave 1, thus I expect sub-wave 5 to NOT extend. Based on Fibonacci extensions, the price target is around $124,600. The stop loss for this idea is around...
Hello everyone! Over in this video, I analyzed the USDJPY and go through how I counted the waves and go through the lower levels sub-wave counts. I believe that USDJPY has completed a triple combination with the Z wave as a 5-wave structure. I talk about how this final wave might not be ideal and propose how the waves might be viewed in a different perspective....
This is an update to the wave counts for Bitcoin. We are in the final wave 5 of 5 of 3 and the target remains at around $124,632. The stop can be adjusted to around $120,433, below the wave 2 of 5 of 3.
Over in this video, I update on the Elliott Wave counts for Bitcoin and explain why I think that Bitcoin is going higher for a wave 5 of 3 of 5. The stop loss will be below the wave 4 and given some leeway, will be around 115,900. There are 2 Take profit targets: 1. 119,251, and 2. 124,632 I made it known that my personal preference is $124,632 but note that...
As I explained in this video, I believe that we are currently in a wave 3 of 5 for Bitcoin and we should be breaching new highs as we have an undergoing wave 3. However, take note that the risk-reward is not good to go long. So I would recommend holding if you already have a position but to be very cautious if you are thinking of initiating a new long...
Stop loss below 3320. This is where Wave W to Wave Y.
Here I discussed how I came out with the completion of the correction for Gold and explain why it may be a good idea to set the stop loss slightly lower.
Over in this video, I did a quick revision on the cycle level Elliott Wave counts for Gold before delving down to the lower timeframes. I discussed the alternate counts for Gold and explained how the latest 5-waves up made me retain what you see as the primary count. Essentially, what is important over here is that the stop loss is $3305 and the potential take...
Based on the Elliott Wave rule that wave 3 is not the shortest wave, I gave a projection on where the peak of both S&P500 and Nasdaq could be. Based on these peaks, the stop is set above and the take profit target is where wave 4 was.
In this video, I explained my change in the Gold Elliott Wave counts on the cycle level (red font numbering) and how I think the Gold price movement will go down in a double combination (because the previous 2 waves are double combinations). I also go through how I set the short target using Fibonacci extensions.
Bitcoin has hit the previous target and even breached lower. Now I believe the time has come to go long again with the stop just below recent low of around $98,500 and the take profit target as the old high of $112,000. Good luck!
Hi, a simple reason to short: 61.8% retracement. Stop above 144.44. Thank you.


