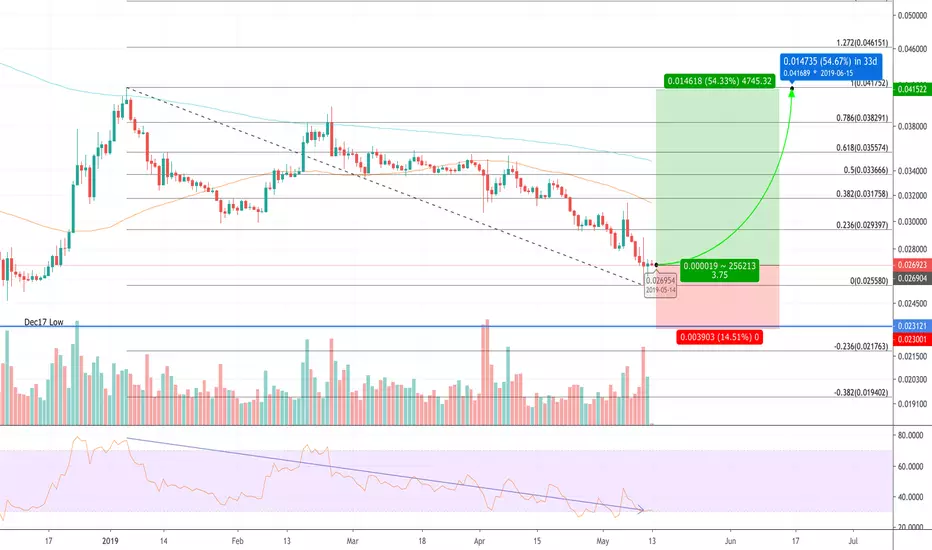
The Fibs seem to match the ETH/BTC movements of the daily candles pretty accurately and although I'm not trying to guess how exactly the price action will behave, it looks like ETH can move from where it is (Close to Fib 0) to the local high (Fib 1 - 0.041ETH/BTC from dec18 to jan19).
The blue line on the bottom is at 0.023ETH/BTC and seems to be the lowest point from a wick from Dec 2017 so this is where I set my SL.
This is a 3.5 R:R trade that could take around a month to reach 55% gains.
I expect this trade to pan out fully in around a month, for 55% gains (over BTC).
Would love to hear your thoughts!
Disclaimer
The information and publications are not meant to be, and do not constitute, financial, investment, trading, or other types of advice or recommendations supplied or endorsed by TradingView. Read more in the Terms of Use.
Disclaimer
The information and publications are not meant to be, and do not constitute, financial, investment, trading, or other types of advice or recommendations supplied or endorsed by TradingView. Read more in the Terms of Use.