O kurwa! Curvature in Technical Analysis: What Does It Tell Us?
Curvature in TA is trading approach where curved lines are used instead of traditional straight trendlines. Curved lines help to visualize how trends evolve and can provide insights into potential reversals or trend continuations.
One of the known methods that utilize curvature is the MIDAS (Market Interpretation/Data Analysis System). This system was developed by physicist Paul Levine in 1995 and uses curved support and resistance lines based on Volume-Weighted Average Price (VWAP). The curves adapt dynamically as price and volume change, helping to identify trend shifts and potential reversals.
💡 Why should we use Curvature?
Dynamic Support and Resistance: Curved lines adapt to price changes, unlike static horizontal lines.
Reversal Signals: They can signal potential trend shifts earlier than traditional methods.
Better Trend Visualization: They are particularly useful for parabolic or exponential price movements.
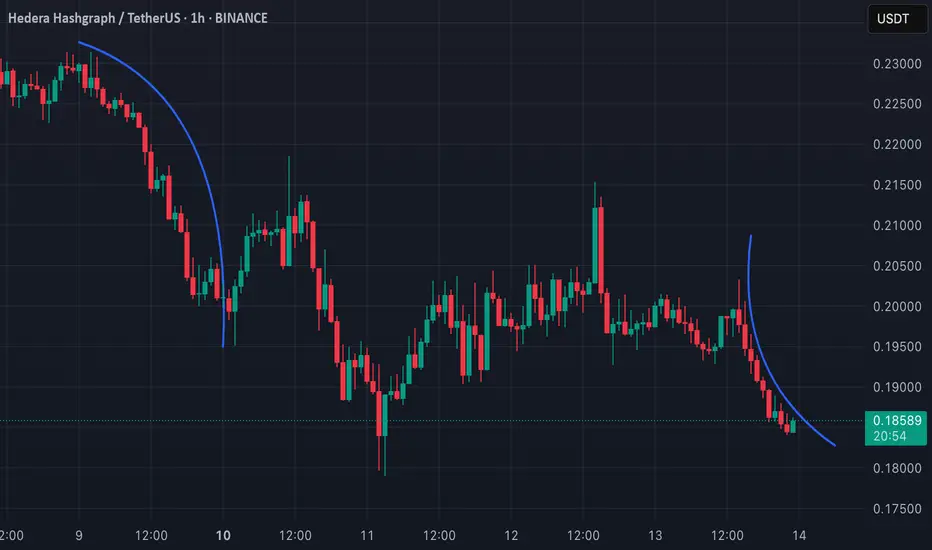
📊 Applying Curvature to HBAR (1H TF)
There are two curves on my chart. Both of them shows a curvature pattern forming on the 1-hour timeframe.
L: The curve on left side indicates a strong downward move, and the price appears to be following this curve closely.
R: On the other hand I have drawn curve on the right side, which is alligned as downward curve as well, but it has different angle.
This post is meant to test my theory on real life example.
🔑 Key Points:
Breaks away from the curvature could indicate a potential trend reversal or consolidation.
Combining this analysis with volume and momentum indicators can improve accuracy when predicting possible bounce or breakdown scenarios. Let's see how it works!
One of the known methods that utilize curvature is the MIDAS (Market Interpretation/Data Analysis System). This system was developed by physicist Paul Levine in 1995 and uses curved support and resistance lines based on Volume-Weighted Average Price (VWAP). The curves adapt dynamically as price and volume change, helping to identify trend shifts and potential reversals.
💡 Why should we use Curvature?
Dynamic Support and Resistance: Curved lines adapt to price changes, unlike static horizontal lines.
Reversal Signals: They can signal potential trend shifts earlier than traditional methods.
Better Trend Visualization: They are particularly useful for parabolic or exponential price movements.
📊 Applying Curvature to HBAR (1H TF)
There are two curves on my chart. Both of them shows a curvature pattern forming on the 1-hour timeframe.
L: The curve on left side indicates a strong downward move, and the price appears to be following this curve closely.
R: On the other hand I have drawn curve on the right side, which is alligned as downward curve as well, but it has different angle.
This post is meant to test my theory on real life example.
🔑 Key Points:
Breaks away from the curvature could indicate a potential trend reversal or consolidation.
Combining this analysis with volume and momentum indicators can improve accuracy when predicting possible bounce or breakdown scenarios. Let's see how it works!
Note
🚀 Update on Curvature AnalysisThanks for the feedback on the previous post! Let's quickly go over some points from comments.
🔍 What to Expect:
The left (<--) curvature could indicate trend continuation, as pointed out by Meganne, while the right (-->) curvature might signal a potential reversal. Considering it’s been the weekend with low volume, we could still see some consolidation before any decisive move, possibly upward, as suggested by SwallowAcademy.
TradingView also noted that curved trendlines can be useful during parabolic moves where linear methods fall short. Well, fingers crossed there! Parabolic could mean
✅ Takeaway:
Curvature on the left (<--) side could indicate trend continuation.
Curvature on the right (-->), on the other hand, could signal a reversal, but before that happens, some consolidation might take place.
Keeping an eye on volume and consolidation is crucial here. If the curvature holds, we might see a bounce soon.
Let's see how it works out during the upcoming working week sessions. 💬
Disclaimer
The information and publications are not meant to be, and do not constitute, financial, investment, trading, or other types of advice or recommendations supplied or endorsed by TradingView. Read more in the Terms of Use.
Disclaimer
The information and publications are not meant to be, and do not constitute, financial, investment, trading, or other types of advice or recommendations supplied or endorsed by TradingView. Read more in the Terms of Use.