HBAR - it's time to run away from it Today we dug up a real crypto zombie! HBAR — is it worth touching or better to avoid? Let me explain:
The token was dead for many years after 2021. But suddenly it grew by hundreds of percent after the ETF application was filed.
I will not discuss how useful this project is or not, let's just lo
Related pairs

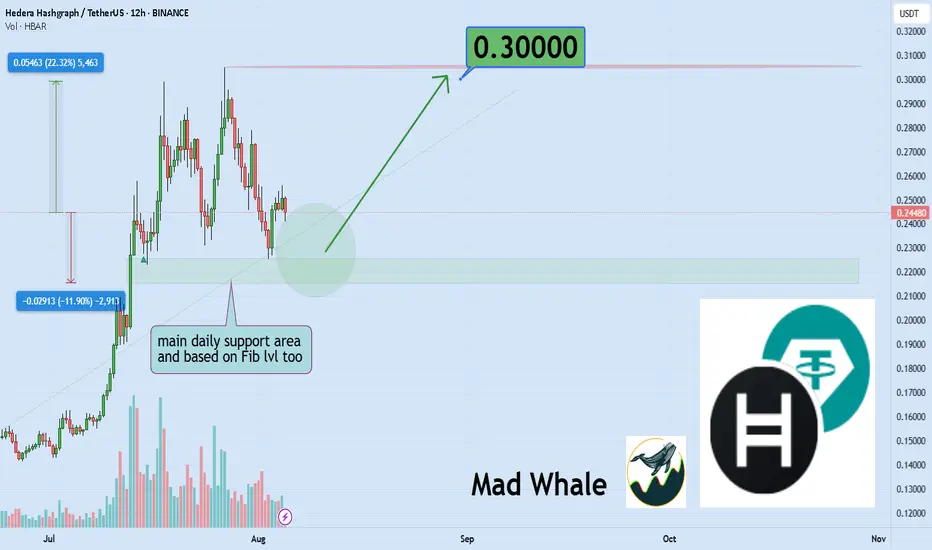
HBAR Set for 22% Rally if Key Support Holds Strong 0.30 targetHello✌
Let’s analyze Hydra Hashgraph’s price action both technically and fundamentally 📈.
🔍Fundamental analysis:
If HBAR’s real use grows, burning fees could rise and boost investor trust. But with 42.4 billion coins out (85% of max), steady demand is needed to handle new unlocks 📊.
📊Techni
Hedera (HBAR): Looks Good For Another 15% Upside MoveAnother BOS that caught our attention happened on HBAR coin, where recently after the local breakout we are seeing a smaller struggle, which might send the price back for a quick retest, where we will be sitting in one of our entry zones. forlong position.
The second one is the other green line, w

$HBAR Is Loading… $0.30 Next?CRYPTOCAP:HBAR has turned its key resistance into support, showing a strong shift in market structure. After reclaiming this level, price has been holding steady above it, supported by the 100 EMA.
As long as bulls defend this zone, the next upside target could be the $0.30 area and beyond.
A cle

HBAR Elder-Ray Index Signals Sustained Selling PressureHBAR’s Elder-Ray Index has remained in negative territory for the past six consecutive daily sessions, reflecting a persistent accumulation weakness. This momentum indicator compares price action to a moving average to gauge the balance between buying and selling pressure. Positive values typically
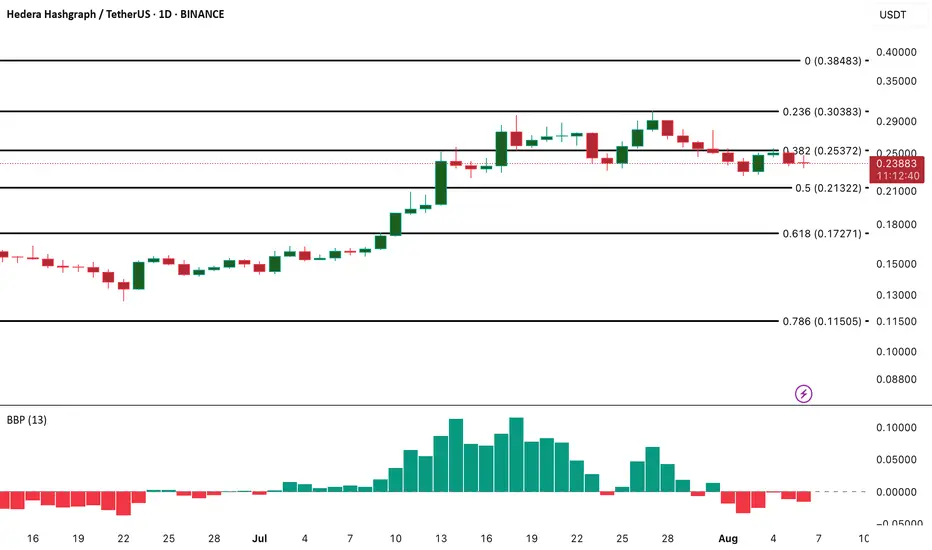
Hedera (HBAR) – Pullback Opportunity After 100% RallyHBAR has surged 100% recently. With the broader market entering contraction, we’re now watching for a healthy retracement into key support, aligning with the 50% Fibonacci level and a fair value gap (FVG). This could be the formation of a higher low before continuation.
🔍 Setup Overview:
Entry Zone

Hbar dump to $0.22904Just now opened up a short position on hbar.
Sl: $0.24598
Tp: $0.22904
Roughly 2RR from my entry.

HBAR: Capitulation - A Major Bottom and High-Reward LongToday we're looking at Hedera (HBAR), which has just experienced a waterfall decline, breaking key structural levels in a classic capitulation event. While the immediate trend is aggressively bearish, these are the exact conditions that often precede major market bottoms and powerful V-shaped recove

HYPE LongFollowing a significant decline, the asset will take support and bounce back from this point.
Disclaimer: This is not financial advice.
This algorithm provides highly precise buy and sell signals with alerts:

HBARUSDT – Planning Ahead, Not Reacting Late In the event of a potential Q3 correction, I believe HBARUSDT could revisit the green box zones below.
These areas aren’t guaranteed bounce points — but they represent fair value in a market pullback scenario.
🧭 How I’m Preparing
📌 No blind orders
📌 Set alerts at the green zones
📌 When price hits

See all ideas
Summarizing what the indicators are suggesting.
Oscillators
Neutral
SellBuy
Strong sellStrong buy
Strong sellSellNeutralBuyStrong buy
Oscillators
Neutral
SellBuy
Strong sellStrong buy
Strong sellSellNeutralBuyStrong buy
Summary
Neutral
SellBuy
Strong sellStrong buy
Strong sellSellNeutralBuyStrong buy
Summary
Neutral
SellBuy
Strong sellStrong buy
Strong sellSellNeutralBuyStrong buy
Summary
Neutral
SellBuy
Strong sellStrong buy
Strong sellSellNeutralBuyStrong buy
Moving Averages
Neutral
SellBuy
Strong sellStrong buy
Strong sellSellNeutralBuyStrong buy
Moving Averages
Neutral
SellBuy
Strong sellStrong buy
Strong sellSellNeutralBuyStrong buy
Displays a symbol's price movements over previous years to identify recurring trends.
Frequently Asked Questions
The current price of Hedera Hashgraph / TetherUS (HBAR) is 0.25618 USDT — it has fallen −3.48% in the past 24 hours. Try placing this info into the context by checking out what coins are also gaining and losing at the moment and seeing HBAR price chart.
Hedera Hashgraph / TetherUS price has risen by 11.59% over the last week, its month performance shows a 35.24% increase, and as for the last year, Hedera Hashgraph / TetherUS has increased by 358.28%. See more dynamics on HBAR price chart.
Keep track of coins' changes with our Crypto Coins Heatmap.
Keep track of coins' changes with our Crypto Coins Heatmap.
Hedera Hashgraph / TetherUS (HBAR) reached its highest price on Sep 16, 2021 — it amounted to 0.57600 USDT. Find more insights on the HBAR price chart.
See the list of crypto gainers and choose what best fits your strategy.
See the list of crypto gainers and choose what best fits your strategy.
Hedera Hashgraph / TetherUS (HBAR) reached the lowest price of 0.00914 USDT on Dec 31, 2019. View more Hedera Hashgraph / TetherUS dynamics on the price chart.
See the list of crypto losers to find unexpected opportunities.
See the list of crypto losers to find unexpected opportunities.
The safest choice when buying HBAR is to go to a well-known crypto exchange. Some of the popular names are Binance, Coinbase, Kraken. But you'll have to find a reliable broker and create an account first. You can trade HBAR right from TradingView charts — just choose a broker and connect to your account.
Crypto markets are famous for their volatility, so one should study all the available stats before adding crypto assets to their portfolio. Very often it's technical analysis that comes in handy. We prepared technical ratings for Hedera Hashgraph / TetherUS (HBAR): today its technical analysis shows the buy signal, and according to the 1 week rating HBAR shows the buy signal. And you'd better dig deeper and study 1 month rating too — it's strong buy. Find inspiration in Hedera Hashgraph / TetherUS trading ideas and keep track of what's moving crypto markets with our crypto news feed.
Hedera Hashgraph / TetherUS (HBAR) is just as reliable as any other crypto asset — this corner of the world market is highly volatile. Today, for instance, Hedera Hashgraph / TetherUS is estimated as 5.46% volatile. The only thing it means is that you must prepare and examine all available information before making a decision. And if you're not sure about Hedera Hashgraph / TetherUS, you can find more inspiration in our curated watchlists.
You can discuss Hedera Hashgraph / TetherUS (HBAR) with other users in our public chats, Minds or in the comments to Ideas.