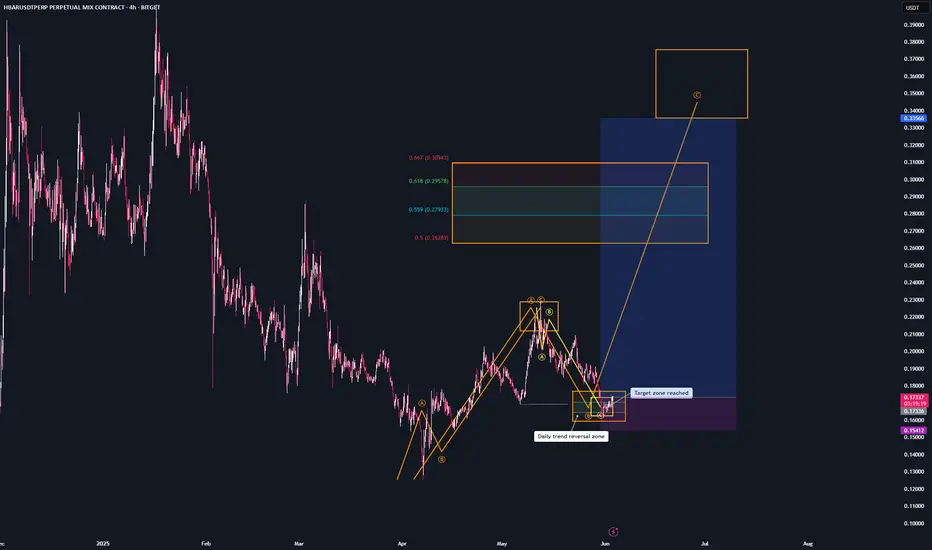
HBAR - setupWe’re still within the bullish trend reversal zone and the bearish target area.
If you’re not positioned long yet, this CRYPTOCAP:HBAR setup is worth considering.
I’m long on this one.
Tp1 + BE : at $0.22 — recent highs
Tp2: at $0.26 — trend reversal area
Tp3: at $0.333— target region
If you have any questions about my system or trade logic, drop them below — I read every comment 👇
HBARUSDT trade ideas

A Colossal Rally Scenario for HBAR to $1,966HBAR is the utility and security token of the Hedera network, a high-performance distributed ledger that aims to be a faster, fairer, and more secure alternative to traditional blockchains, specifically designed to meet the needs of mainstream and enterprise-level applications.
Chart Pattern Analysis
Major Pattern: Descending Triangle
The most significant pattern on this monthly chart is a large descending triangle that has been forming since late 2021.
The upper boundary is a descending trendline connecting the lower highs.
The lower boundary is a strong horizontal support line around the $0.042 level, which was tested and held multiple times throughout 2023.
Bullish Breakout and Retest
In early 2025 (according to the chart's timeline), the price has decisively broken out of the top of this descending triangle. A breakout from such a long-term consolidation pattern is typically a very strong bullish signal.
Following the breakout, the price seems to be performing a retest. It has come back down to touch the former resistance trendline, which is now acting as new support. This is a classic technical move that confirms the strength of the breakout.
Candlestick Analysis
The breakout candle is a strong, full-bodied green candle, indicating significant buying pressure and conviction behind the move.
The most recent candles are consolidating above the breakout level, holding the new support. This suggests that buyers are absorbing any selling pressure and preparing for the next move higher.
Price Prediction
Based on this technical setup, the outlook for HBAR is bullish.
Short-Term to Medium-Term: After successfully holding the retest of the broken trendline, the price is poised to continue its upward trend. The first major target would be the previous all-time high from 2021 (around $0.57).
Long-Term Projection: The analyst who created the chart has plotted a very ambitious long-term target at $1,966.87643. This is likely a calculated "measured move" of the triangle pattern, projected upwards from the breakout point. While the pattern itself is very bullish, this specific target is extremely optimistic and would represent a massive, multi-year bull run.
Summary
The chart suggests that HBAR has completed a long bearish/consolidation phase and has begun a new major uptrend. The breakout from the multi-year descending triangle, confirmed by a successful retest, is a powerful signal for future price appreciation.
The price is expected to go up. The immediate trajectory is likely continued upward movement, with key historical resistance levels as initial targets. The extremely high long-term target should be viewed as a highly speculative, best-case scenario.
Key Levels to Watch:
Support: The descending trendline (currently around 0.12−0.15) and the horizontal support at $0.11705.
Invalidation Point: A decisive drop back below the major support level at $0.04207 would invalidate this bullish thesis.

Short time Frame Hbar, NFA just one of the potentials I see Just a quick look at the shorter time frame working hopefully into the next leg up.
Hope to see one more downside movement that will get eaten up good at around the prices mentioned and then maybe we can finally trend up after this 7-9 month correction depending if we end in June or August haha
Always prepared for the worst, but embracing the positives that are given!
As always take with a grain of salt things can change quickly.

HBARUSDT 4D AnalysisHBAR ~ 4D Analysis
#HBAR This is the closest support for now. Buy if you still have faith in this coin with a short term target of at least 15%+ from here.

HBAR - TradeI got stopped out on HBAR,
but I’m still holding multiple long positions on other altcoins.
Most coins seem to be forming bottom structures.
HBAR just swept recent significant lows
and is now showing bullish divergence on the 8H and 20H timeframes — which is typically a strong sign of a bottom.

HBAR needs to set a foundation and a CHOCH would be greatHBAR fell through a large volume gap. Momentum remains in a downtrend, and the structure is not yet mature. A proper CHOCH would make things bullish, especially in oversold conditions.
Full TA: Link in the BIO

Technical Analysis – HBAR/USDT + TRADE PLANTechnical Analysis – HBAR/USDT (Daily Chart as of June 4, 2025)
Chart Pattern: Falling Wedge (Bullish)
The chart indicates a classic falling wedge pattern, often interpreted as a bullish reversal signal.
This pattern is marked by descending converging trendlines, suggesting declining volatility and potential breakout.
Breakout point is illustrated just above the wedge’s resistance line, with a bullish breakout expected.
Key Support & Resistance Levels
Immediate Support Zone: $0.1625 – $0.1723 (blue zone)
Primary Resistance Targets:
Short-term: $0.1849 (top of Bollinger Band)
Mid-term: $0.2070 – $0.2200
Long-term: $0.3400 (strong historical resistance)
Indicators Summary
Bollinger Bands: Price near the lower band, indicating potential upside volatility.
Volume Profile: Slightly increasing near wedge apex, often a precursor to a breakout.
VMC Cipher_B: Multiple green dots signal bullish divergence; momentum may be reversing upward.
RSI (14): Currently recovering from oversold territory (~39.5), suggesting bullish momentum building.
Money Flow Index (ArTy): Moving back into the green, indicating capital inflow and potential accumulation.
Stochastic RSI: Crossed upward from oversold zone (currently ~23), a common signal for trend reversal.
Trading Plan
Long Position Setup (Swing Trade)
Entry Zone:
$0.1650 – $0.1725 (upon retest of breakout from wedge or candle close above wedge resistance)
Stop-Loss:
$0.1580 (below wedge support and key structure low)
Take-Profit Targets:
TP1: $0.1850 (Bollinger Band and resistance zone)
TP2: $0.2070 (resistance from March 2025)
TP3: $0.2200 – $0.2400 (target zone for full wedge breakout)
TP4: $0.3400 (macro-level resistance, if rally continues)
Risk-to-Reward:
Minimum R:R of 1:2.5 to 1:5 depending on TP level.
⚠️ Risk Management & Strategy Notes
Wait for confirmation breakout candle with strong volume above wedge resistance before entering.
Scale in gradually between $0.1650–$0.1725 if confirmed.
Trail stop-loss after reaching TP1 to lock in profits.
Monitor Bitcoin price trend and overall market sentiment—HBAR tends to follow macro market structure.
The combination of the falling wedge, bullish divergence, and oversold momentum indicators supports a strong potential for bullish continuation. However, conservative confirmation is essential before committing capital.
Outlook: Bullish bias, pending confirmation breakout above the wedge resistance.

HBAR - TradeMy orders on CRYPTOCAP:HBAR got filled.
I’m riding the next wave up with consistent profit-taking — at the highs, the major trend reversal zone, and eventually the target regions of the new formed structure.
HBAR SetupWe finally hit your entry region on HBAR.
It’s very likely that we’ll see a U-turn from this area.
Of course, there might still be some choppy days before the reversal kicks in.
I'm opening a new swing position here and now, which I’ll hold until we reach the target zones.

Hbar setupWe’re currently trading just above the bullish trend reversal zone and the bearish target region.
If we drop into these areas, I’ll open additional long positions on HBAR and scale up my larger long swing position as well.

HEDERAset up LONG 1:1 quick
Disclaimer on Money Management for Trading in the Futures MarketFutures trading carries high risks and may result in the loss of your entire capital. Only use funds you can afford to lose, set risk limits, and understand the market and leverage. Diversification does not guarantee profits. Consult a financial advisor before trading. All decisions and losses are your sole responsibility.

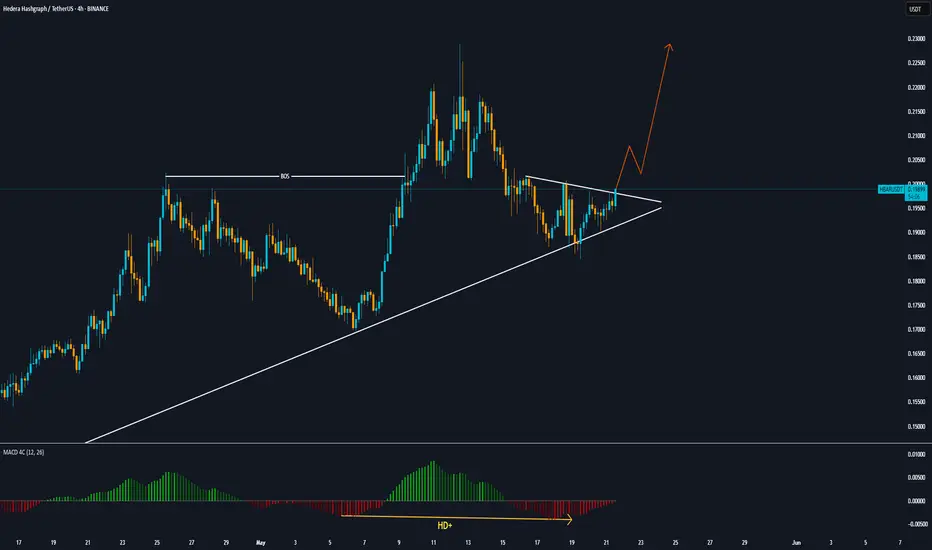
HBAR Massive Wedge PatternHBAR created massive clear wedge pattern
we must break upper trendline to go up and potentialy to 0.23
But if we break support line this is will be invalidate

HBARUSDT in a falling wedgeHi traders,
Today, we are analysing HBAR on a weekly timeframe.
The price remains under the downsloping resistance line.
The price also formed a falling wedge pattern.
Enter long position once the breakout occurs.
The target is shown on the chart.
Good luck


HBAR Short Wait for Good EntryLike & Follow me for more details
HBAR Short,
BTC will break upward trend soon.
Will reach 103k

HBAR Masterclass: Fib Precision + ConfluenceHBAR has been a dream to chart lately — beautifully technical, clean reactions, and a strong respect for structure. When a chart follows fibs this precisely, charting becomes fun — like solving a puzzle that pays. You stop forcing trades and start enjoying the process.
Let’s break down where the next high-probability trade setup lies — and why.
Elliott Wave Context
HBAR recently completed a 5-wave impulse structure and is now unfolding a ABC correction:
✅ Wave A: Broke below Wave 4's low
✅ Wave B: Rejected cleanly at the 0.618 retracement of Wave A
🔄 Wave C: Currently unfolding, with price structure hinting at a Head & Shoulders forming to the downside
Interestingly, HBAR has been bouncing between golden ratios like a Fibonacci pinball machine. — reinforcing how well this asset respects technical structure.
🟢 Long Opportunity: The Golden Pocket Zone
By pulling Fibonacci retracement from the entire 5-wave leg (from $0.16941 to $0.22885), we uncover the golden pocket:
0.618 Fib → $0.19212
0.666 Fib → $0.18926
But what really strengthens this zone is the confluence:
📍 21-Day EMA → $0.19361
📍 21-Day SMA → $0.19229
📍 Anchored VWAP from the $0.15396 low → ~$0.19135
📍 4/1 Gann Fan support (if reached between May 15–17)
Together, they form a tight support band between:
🎯 $0.195 – $0.18926
📐 How We Projected the 1.618 Target
Here’s where the magic of planning comes in.
If Wave C finishes within this golden pocket, we can anticipate the next move by applying a trend-based Fibonacci extension. This gives us a realistic projection for the next impulsive move:
📈 1.618 extension lands at → $0.28654
This level also aligns with the yearly level and previous key high — forming an ideal final target
📘 Educational Insight: Why Golden Pockets Matter
In trading, the “golden pocket” — the 0.618-0.666 Fibonacci retracement zone — is often where high-probability reversals take place. It’s a zone where buyers (or sellers) return with conviction after a correction. When this area also aligns with EMAs, anchored VWAPs, Gann levels etc. and previous structure, it becomes more than just a level — it becomes a decision zone.
This is where confluence transforms a trade idea into a trade setup.
🟢 Long Trade Setup:
Entry: Laddered between $0.195 – $0.18926
Stop-Loss: Below $0.185
Take-Profit: $0.28654
R:R: ~10:1
Potential Gain: ~+50%
🔴 Short Setup (If Rejected at Extension):
If price hits $0.28654 and shows exhaustion or bearish reversal patterns (SFP, engulfing candle, volume spike), a short could be considered:
Entry: ~$0.286
Stop-Loss: $0.2967 (better above $0.3)
Target: $0.2622
R:R: ~2:1
HBAR is giving us a textbook case of structure, rhythm, and precision. Whether it’s the golden pocket, the 1.618 extension, or the alignment of multiple tools — this is how clean setups are built.
Set your alerts. Trust the plan. Let the chart come to you.
In trading, silence is a skill — knowing when not to act is as powerful as knowing when to strike.
____________________________________
If you found this helpful, leave a like and comment below! Got requests for the next technical analysis? Let me know.

Hbar Getting close to that run First post ever so NFA and take it with a grain of salt
Scenario 1
Target .956, 1.40 and 2.30 Max (only with insane news and sentiment combo for the 2 after .956) Still feeling we might see a decline to .1650 or .1250 ish areas again before the nice run. Have 1 scenario with .0956 ish also if we fall off of a cliff for some reason. Next 2 weeks here are crucial for structure IMO

HBAE Bullish position H4This currency is in a good buying position and has a potential return of up to 15% in the first stage. Positive divergence and its reaction to the trend line can be evidence of an uptrend.
$HBAR just did something interesting...After months of being stuck in a downtrend channel, it finally broke out, and now it's retesting that breakout zone.
This is when weak hands panic… and smart money watches closely.
A stronghold here could trigger a move nobody’s ready for.
Next major target? $0.40+ isn't off the table. 🚀
Watching this one like a hawk.
DYRO, NFA

Hbar PlanMarket is giving us high probability setup. Once we come down we should see a V-Turn
Rn im doing nothing
im just waiting for it to come to 0.17$
If the market comes all the way down, i will open a swing position with bigger margine.

Hedera (HBAR): Seeing Good Momentum | Eyes on EMAsHedera has formed a nice small uptrend here where buyers recently broke the 200EMA mark on the daily timeframe. As we are seeing some sort of buying volume forming here, we are waiting for a proper bounce from here, which would mean that we would continue the growth in this small trend.
Setup is valid as long as we are above 200EMA
Swallow Academy

Hbar dump back to $0.2 today?Entered hbar short just now.
Target: $0.2
Stop: $0.21029 or higher
Roughly 3RR

HBAR CONSOLIDATION - When Breakout?CRYPTOCAP:HBAR has been seen to range within the box on the 1hr timeframe chart since 10th May and it’s still within the box.
What do you expect - upward or downward breakout?
Please support this idea with a LIKE👍 if you find it useful🥳
Happy Trading💰🥳🤗
