SP500: Bearish Forecast for Major Indices Starting May 15, 2025
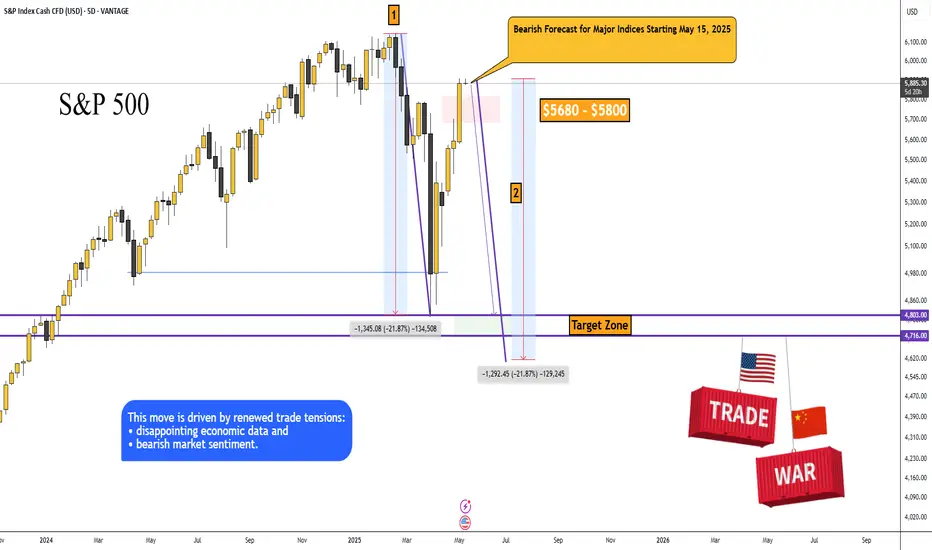
Bearish Forecast for Major Indices Starting May 15, 2025
The S&P 500, Dow Jones, Nikkei 225, and other major indices are poised to begin a significant decline, potentially as early as today, May 15, 2025, targeting a retest of the price lows from April 7, 2025, and possibly lower (S&P 500: ~4,802.20, Dow Jones: ~36,611.78, Nikkei: ~30,340.50).
This movement is driven by renewed trade tensions, disappointing economic data, and pervasive bearish market sentiment.

1. Fundamental Factors Driving Potential Decline
1.1. Renewed Uncertainty in Trade Policy
· The rally in indices on May 12–13, 2025, was fueled by optimism surrounding a temporary U.S.-China tariff reduction agreement (a 90-day truce) announced after talks in Switzerland on May 11, 2025. However, as of May 15, 2025, investor confidence may be waning due to a lack of tangible progress in ongoing U.S.-China trade negotiations.
Trigger for May 15: Recent reports highlight conflicting statements from the Trump administration, with earlier promises of new trade deals (e.g., a U.K. deal on May 8) followed by uncertainty. A Reuters report from May 14, 2025, notes that U.S. Trade Representative Jamieson Greer and Treasury Secretary Scott Bessent are meeting with Chinese officials, but no new agreements have been confirmed. If today’s talks yield no positive outcomes or if President Trump escalates rhetoric (e.g., reinstating higher tariffs), markets could plummet, as seen in early April when tariffs triggered a 15% drop in the S&P 500.
· Trade war fears disproportionately impact export-heavy indices like the Nikkei, which is sensitive to yen appreciation and U.S.-China tensions, and the Dow Jones, with its significant exposure to multinational corporations. A breakdown in negotiations could drive indices toward the April 7 lows as investors price in higher costs and slower global growth.
1.2. Disappointments in Economic Data
· CPI Reaction: The April 2025 Consumer Price Index (CPI), released on May 14, 2025, reported inflation at 2.3% annually, below the expected 2.4%. While initially viewed as positive, markets may have anticipated an even lower figure to justify Federal Reserve rate cuts. The modest S&P 500 gain (+0.7%) and Dow’s decline (-0.6%) on May 14 suggest investor skepticism about further inflation cooling.

· Producer Price Index (PPI) Release on May 15: The PPI for April 2025, scheduled for release at 8:30 AM ET (2:30 PM CEST) on May 15, 2025, is a pivotal event. If the PPI indicates persistent wholesale inflation—potentially driven by tariff-related cost pressures—it could signal rising consumer prices ahead, diminishing hopes for Fed policy easing and triggering a sell-off. A higher-than-expected PPI could echo the market’s reaction to mixed economic data in early April, when GDP contraction fears pushed indices lower.
· Consumer Sentiment: The University of Michigan Consumer Sentiment Index for May 2025, released on May 14, 2025, likely showed continued weakness (April’s reading was 52.2, a multi-year low). If the May figure, reported yesterday, declined further, it could amplify concerns about reduced consumer spending, negatively impacting corporate earnings and pushing indices downward.
1.3. Concerns Over Federal Reserve Policy
· On May 7, 2025, Fed Chair Jerome Powell highlighted heightened economic risks, citing “elevated uncertainty” due to trade policies. Markets are pricing in 75 basis points of rate cuts for 2025, with the first cut expected in July.
· Trigger for May 15: If today’s PPI data or other economic indicators (e.g., Initial Jobless Claims, also due at 8:30 AM ET) point to persistent inflation or economic weakness, expectations for rate cuts could fade, increasing borrowing costs for companies and pressuring equity valuations. This scenario would mirror April 7, when recession fears and tariff impacts drove the S&P 500 below 5,000.
2. Technical Analysis
· The initial impulse move saw a decline of approximately -21.87%, with a second impulse of similar magnitude (marked on the chart). Currently, markets are aligned for a simultaneous decline across asset classes: oil, cryptocurrencies, and major indices like the S&P 500, Dow Jones, Nikkei, and others.
· Previous analysis concluded that this is a correction preceding a broader decline in indices, driven by trade wars, geopolitical conflicts, and U.S. economic indicators. I believe a recession is already underway.
Price Targets for S&P 500 Decline:
➖ Retest of the April 7, 2025, low: $4,803.00
➖ Secondary target: $4,716.00
3. Market Sentiment and Behavioral Factors
3.1. Fragile Optimism Post-Rally
· The S&P 500’s 22% rally from April lows and the Dow’s 15% recovery were driven by trade truce optimism and strength in technology stocks (e.g., Nvidia, Palantir). However, Bloomberg reported on May 14, 2025, that Wall Street’s rebound is “showing signs of exhaustion” due to trade war risks and fears of an economic slowdown. This fragility could lead to profit-taking today if negative news emerges.
· The Dow’s weakness on May 14 (down 0.6% compared to the S&P 500’s 0.7% gain) highlights vulnerabilities in specific sectors (e.g., healthcare following UnitedHealth’s 18% drop), which could spread to broader markets.
3.2. Global Market Correlation
· Asian markets, including the Nikkei, exhibited mixed performance on May 14, with China’s CSI 300 up slightly (+0.15%) and India’s Nifty 50 down 1.27%. If Asian markets open lower on May 15 due to overnight U.S. declines or trade-related news, it could create a feedback loop, intensifying global selling pressure.
4. Mini Evidence-Based Framework for the Forecast
4.1. Catalysts for Today’s Decline (May 15, 2025)
PPI Data (8:30 AM ET): A higher-than-expected PPI could signal persistent inflation, reducing the likelihood of Fed rate cuts and triggering a sell-off. Consensus anticipates a 0.2% monthly increase; a reading above 0.3% could be bearish.
Trade Talk Updates: Negative commentary from U.S. or Chinese officials (e.g., no deal reached in Geneva) could reignite trade war fears, mirroring the April 7 sell-off.
Initial Jobless Claims (8:30 AM ET): An unexpected rise in claims (e.g., above 220,000 compared to the prior fmadd211,000) could signal labor market weakness, amplifying recession fears.
4.2. Global Scenario for S&P 500
· I anticipate a wave-like decline with intermittent corrections. I wouldn’t be surprised if the S&P 500 falls below 4,700, potentially reaching 4,200. Extreme caution is warranted this year.
· There’s even a theory that, starting in 2025, the U.S. dollar could lose 50% of its purchasing power.
Idea:


4.3. Oil and Geopolitical Outlook


I expect oil (Brent) to decline to the $50+/- range, from which an upward trend may begin, potentially tied to future military conflicts:
· Europe vs. Russia
· India vs. Pakistan
· Iran vs. Israel
The S&P 500, Dow Jones, Nikkei 225, and other major indices are poised to begin a significant decline, potentially as early as today, May 15, 2025, targeting a retest of the price lows from April 7, 2025, and possibly lower (S&P 500: ~4,802.20, Dow Jones: ~36,611.78, Nikkei: ~30,340.50).
This movement is driven by renewed trade tensions, disappointing economic data, and pervasive bearish market sentiment.
1. Fundamental Factors Driving Potential Decline
1.1. Renewed Uncertainty in Trade Policy
· The rally in indices on May 12–13, 2025, was fueled by optimism surrounding a temporary U.S.-China tariff reduction agreement (a 90-day truce) announced after talks in Switzerland on May 11, 2025. However, as of May 15, 2025, investor confidence may be waning due to a lack of tangible progress in ongoing U.S.-China trade negotiations.
Trigger for May 15: Recent reports highlight conflicting statements from the Trump administration, with earlier promises of new trade deals (e.g., a U.K. deal on May 8) followed by uncertainty. A Reuters report from May 14, 2025, notes that U.S. Trade Representative Jamieson Greer and Treasury Secretary Scott Bessent are meeting with Chinese officials, but no new agreements have been confirmed. If today’s talks yield no positive outcomes or if President Trump escalates rhetoric (e.g., reinstating higher tariffs), markets could plummet, as seen in early April when tariffs triggered a 15% drop in the S&P 500.
· Trade war fears disproportionately impact export-heavy indices like the Nikkei, which is sensitive to yen appreciation and U.S.-China tensions, and the Dow Jones, with its significant exposure to multinational corporations. A breakdown in negotiations could drive indices toward the April 7 lows as investors price in higher costs and slower global growth.
1.2. Disappointments in Economic Data
· CPI Reaction: The April 2025 Consumer Price Index (CPI), released on May 14, 2025, reported inflation at 2.3% annually, below the expected 2.4%. While initially viewed as positive, markets may have anticipated an even lower figure to justify Federal Reserve rate cuts. The modest S&P 500 gain (+0.7%) and Dow’s decline (-0.6%) on May 14 suggest investor skepticism about further inflation cooling.
· Producer Price Index (PPI) Release on May 15: The PPI for April 2025, scheduled for release at 8:30 AM ET (2:30 PM CEST) on May 15, 2025, is a pivotal event. If the PPI indicates persistent wholesale inflation—potentially driven by tariff-related cost pressures—it could signal rising consumer prices ahead, diminishing hopes for Fed policy easing and triggering a sell-off. A higher-than-expected PPI could echo the market’s reaction to mixed economic data in early April, when GDP contraction fears pushed indices lower.
· Consumer Sentiment: The University of Michigan Consumer Sentiment Index for May 2025, released on May 14, 2025, likely showed continued weakness (April’s reading was 52.2, a multi-year low). If the May figure, reported yesterday, declined further, it could amplify concerns about reduced consumer spending, negatively impacting corporate earnings and pushing indices downward.
1.3. Concerns Over Federal Reserve Policy
· On May 7, 2025, Fed Chair Jerome Powell highlighted heightened economic risks, citing “elevated uncertainty” due to trade policies. Markets are pricing in 75 basis points of rate cuts for 2025, with the first cut expected in July.
· Trigger for May 15: If today’s PPI data or other economic indicators (e.g., Initial Jobless Claims, also due at 8:30 AM ET) point to persistent inflation or economic weakness, expectations for rate cuts could fade, increasing borrowing costs for companies and pressuring equity valuations. This scenario would mirror April 7, when recession fears and tariff impacts drove the S&P 500 below 5,000.
2. Technical Analysis
· The initial impulse move saw a decline of approximately -21.87%, with a second impulse of similar magnitude (marked on the chart). Currently, markets are aligned for a simultaneous decline across asset classes: oil, cryptocurrencies, and major indices like the S&P 500, Dow Jones, Nikkei, and others.
· Previous analysis concluded that this is a correction preceding a broader decline in indices, driven by trade wars, geopolitical conflicts, and U.S. economic indicators. I believe a recession is already underway.
Price Targets for S&P 500 Decline:
➖ Retest of the April 7, 2025, low: $4,803.00
➖ Secondary target: $4,716.00
3. Market Sentiment and Behavioral Factors
3.1. Fragile Optimism Post-Rally
· The S&P 500’s 22% rally from April lows and the Dow’s 15% recovery were driven by trade truce optimism and strength in technology stocks (e.g., Nvidia, Palantir). However, Bloomberg reported on May 14, 2025, that Wall Street’s rebound is “showing signs of exhaustion” due to trade war risks and fears of an economic slowdown. This fragility could lead to profit-taking today if negative news emerges.
· The Dow’s weakness on May 14 (down 0.6% compared to the S&P 500’s 0.7% gain) highlights vulnerabilities in specific sectors (e.g., healthcare following UnitedHealth’s 18% drop), which could spread to broader markets.
3.2. Global Market Correlation
· Asian markets, including the Nikkei, exhibited mixed performance on May 14, with China’s CSI 300 up slightly (+0.15%) and India’s Nifty 50 down 1.27%. If Asian markets open lower on May 15 due to overnight U.S. declines or trade-related news, it could create a feedback loop, intensifying global selling pressure.
4. Mini Evidence-Based Framework for the Forecast
4.1. Catalysts for Today’s Decline (May 15, 2025)
PPI Data (8:30 AM ET): A higher-than-expected PPI could signal persistent inflation, reducing the likelihood of Fed rate cuts and triggering a sell-off. Consensus anticipates a 0.2% monthly increase; a reading above 0.3% could be bearish.
Trade Talk Updates: Negative commentary from U.S. or Chinese officials (e.g., no deal reached in Geneva) could reignite trade war fears, mirroring the April 7 sell-off.
Initial Jobless Claims (8:30 AM ET): An unexpected rise in claims (e.g., above 220,000 compared to the prior fmadd211,000) could signal labor market weakness, amplifying recession fears.
4.2. Global Scenario for S&P 500
· I anticipate a wave-like decline with intermittent corrections. I wouldn’t be surprised if the S&P 500 falls below 4,700, potentially reaching 4,200. Extreme caution is warranted this year.
· There’s even a theory that, starting in 2025, the U.S. dollar could lose 50% of its purchasing power.
Idea:
4.3. Oil and Geopolitical Outlook
I expect oil (Brent) to decline to the $50+/- range, from which an upward trend may begin, potentially tied to future military conflicts:
· Europe vs. Russia
· India vs. Pakistan
· Iran vs. Israel
Trade active
Note
Hello everyone. 👋I haven’t followed the markets for almost a week, and now it looks like trade wars again based on the chart.
I’m taking a one-month break. I’ll focus on developing a GPU-based program for finding old, forgotten Bitcoin wallets.
I found a working CPU version and a semi-working GPU version; I’ll refine it to eventually set it up on a server to search for that “treasure chest of gold 🪙” on its own.
Locally, I was wrong about the crypto market; I didn’t expect Bitcoin to surpass its highs. 😮
I’m waiting for new lows on SP500, Dow Jones, Bitcoin, etc., before looking at the market again in a month.
I need to analyze my mistakes and try to read the charts more accurately in the future.
Related publications
Disclaimer
The information and publications are not meant to be, and do not constitute, financial, investment, trading, or other types of advice or recommendations supplied or endorsed by TradingView. Read more in the Terms of Use.
Related publications
Disclaimer
The information and publications are not meant to be, and do not constitute, financial, investment, trading, or other types of advice or recommendations supplied or endorsed by TradingView. Read more in the Terms of Use.