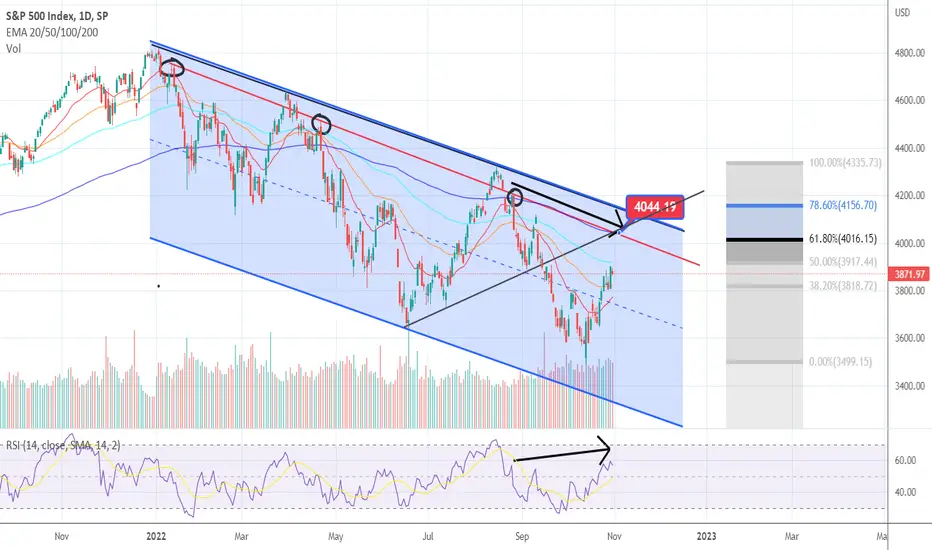
So we have a heavy resistance around 4044 IF the SPX will reach that target.
We can see that with the RED trendline and the black circles.
Black support line will become a resistance line?
Also the FIB 61.8° and the daily 200 EMA is overthere
There's also a hidden bearish divergence. Lower highs in the chart and Higher highs in the RSI
The trend is still down.
IMO no reason For staying bullish -> high inflation , high interest rates
So yes for me is this just a bear market rally
The time will tell
My end target you can find in my previous ideas
Note
The Title should be S&P 500, my apologiseDisclaimer
The information and publications are not meant to be, and do not constitute, financial, investment, trading, or other types of advice or recommendations supplied or endorsed by TradingView. Read more in the Terms of Use.
Disclaimer
The information and publications are not meant to be, and do not constitute, financial, investment, trading, or other types of advice or recommendations supplied or endorsed by TradingView. Read more in the Terms of Use.