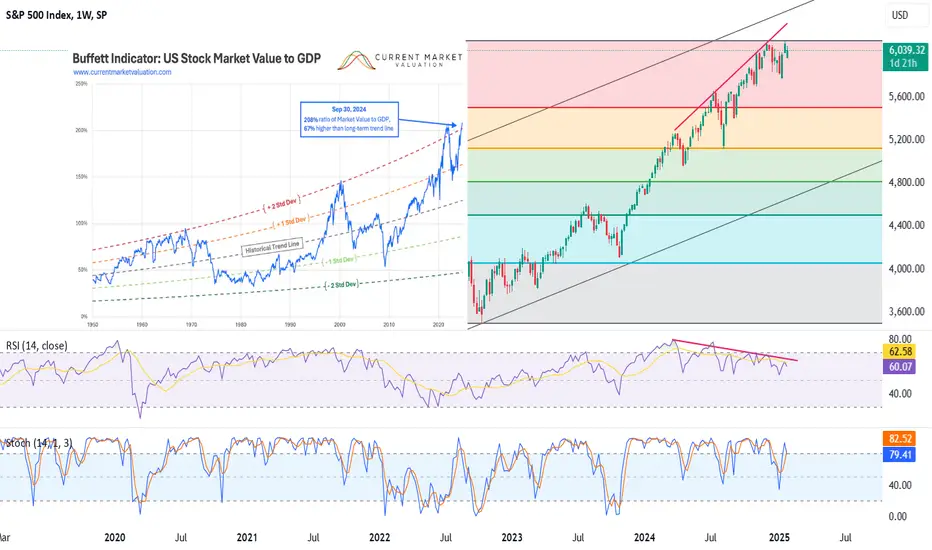
The Buffett Indicator (aka, Buffett Index, or Buffett Ratio) is the ratio of the total United States stock market to GDP.
This ratio fluctuates over time since the value of the stock market can be very volatile, but GDP tends to grow much more predictably. The current ratio of 208% is approximately 66.62% (or about 2.2 standard deviations) above the historical trend line, suggesting that the stock market is Strongly Overvalued relative to GDP.
The Buffett Indicator expresses the value of the US stock market in terms of the size of the US economy. If the stock market value is growing much faster than the actual economy, then it may be in a bubble.
The P/E ratio is a classic measure of a stock's value indicating how many years of profits (at the current earnings rate) it takes to recoup an investment in the stock. The current S&P500 10-year P/E Ratio is 36.5. This is 79.2% above the modern-era market average of 20.4, putting the current P/E 2.0 standard deviations above the modern-era average. This suggests that the market is Strongly Overvalued.
P/E ratios can only go so high. To justify a P/E ratio that is consistently above its own historic average for long periods of time, the US stock market must not only continue to grow, but would need to continue to grow at a continuously increasing rate.
Disclaimer
The information and publications are not meant to be, and do not constitute, financial, investment, trading, or other types of advice or recommendations supplied or endorsed by TradingView. Read more in the Terms of Use.
Disclaimer
The information and publications are not meant to be, and do not constitute, financial, investment, trading, or other types of advice or recommendations supplied or endorsed by TradingView. Read more in the Terms of Use.