Valuation Correction or the Start of a Breakdown?
Zoom out. Clear the noise.
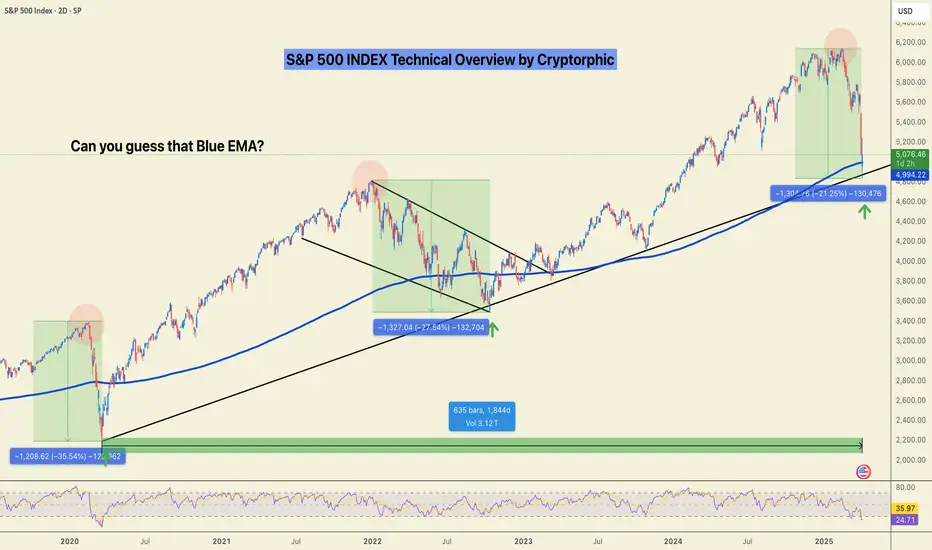
We might still sweep the lows, but when viewed on the weekly timeframe, this current S&P 500 move looks more like a healthy valuation correction than a structural breakdown.
Let’s break it down by the numbers using fractal analysis:
🟩 March 2020 (COVID Crash):
▪️~35% drop
▪️V-shaped recovery
▪️Oversold RSI bounce
🟨 2022 Bear Market:
▪️~27% correction
▪️Multi-month wedge consolidation
▪️Eventually led to an upside breakout
🟦 Now (2025):
▪️~21% correction so far
▪️Retesting long-term trendline
▪️RSI in familiar oversold zone
📊 Fractal Math:
- From 35% to 27% = 22.86% decrease
- From 27% to 21% = 22.22% decrease
Both legs show a consistent ~22% drop in correction depth suggesting bearish momentum is weakening with each cycle. Currently bouncing off the1844 days of support.
Is this the bottom? Will there be relief?
🔁 If this pattern holds:
- We could see a short-term sweep or deviation under recent lows.
- But structure favours a potential recovery from this zone, unless the trendline breaks decisively.
📌 Watch levels closely. Timing matters.
🧠 What’s your take, is this another “buy the dip” moment?
Do hit the like button if you liked this update and share your views in the comment section.
Zoom out. Clear the noise.
We might still sweep the lows, but when viewed on the weekly timeframe, this current S&P 500 move looks more like a healthy valuation correction than a structural breakdown.
Let’s break it down by the numbers using fractal analysis:
🟩 March 2020 (COVID Crash):
▪️~35% drop
▪️V-shaped recovery
▪️Oversold RSI bounce
🟨 2022 Bear Market:
▪️~27% correction
▪️Multi-month wedge consolidation
▪️Eventually led to an upside breakout
🟦 Now (2025):
▪️~21% correction so far
▪️Retesting long-term trendline
▪️RSI in familiar oversold zone
📊 Fractal Math:
- From 35% to 27% = 22.86% decrease
- From 27% to 21% = 22.22% decrease
Both legs show a consistent ~22% drop in correction depth suggesting bearish momentum is weakening with each cycle. Currently bouncing off the1844 days of support.
Is this the bottom? Will there be relief?
🔁 If this pattern holds:
- We could see a short-term sweep or deviation under recent lows.
- But structure favours a potential recovery from this zone, unless the trendline breaks decisively.
📌 Watch levels closely. Timing matters.
🧠 What’s your take, is this another “buy the dip” moment?
Do hit the like button if you liked this update and share your views in the comment section.
Daily Signals:- telegram.me/thecryptorphic
Best Exchange BITUNIX: bit.ly/JoinCryptorphic
BLOFIN - bit.ly/Cryptorphic
Binance: bit.ly/cryptorphic1000
ELITES: bit.ly/Join_elite
Best Exchange BITUNIX: bit.ly/JoinCryptorphic
BLOFIN - bit.ly/Cryptorphic
Binance: bit.ly/cryptorphic1000
ELITES: bit.ly/Join_elite
Related publications
Disclaimer
The information and publications are not meant to be, and do not constitute, financial, investment, trading, or other types of advice or recommendations supplied or endorsed by TradingView. Read more in the Terms of Use.