The SPDR S&P 500 ETF Trust (SPY) is currently exhibiting an ascending wedge pattern on the 30-minute chart, a bearish technical pattern that often signals a potential reversal or selloff when confirmed. Below, I’ll explain the ascending wedge pattern, identify key levels to watch for a potential selloff, and provide context based on recent market sentiment. Since I cannot view the real-time chart, I’ll base the analysis on the characteristics of an ascending wedge and recent posts on X that discuss SPY’s price action, ensuring a critical approach to the data.
What is an Ascending Wedge Pattern?
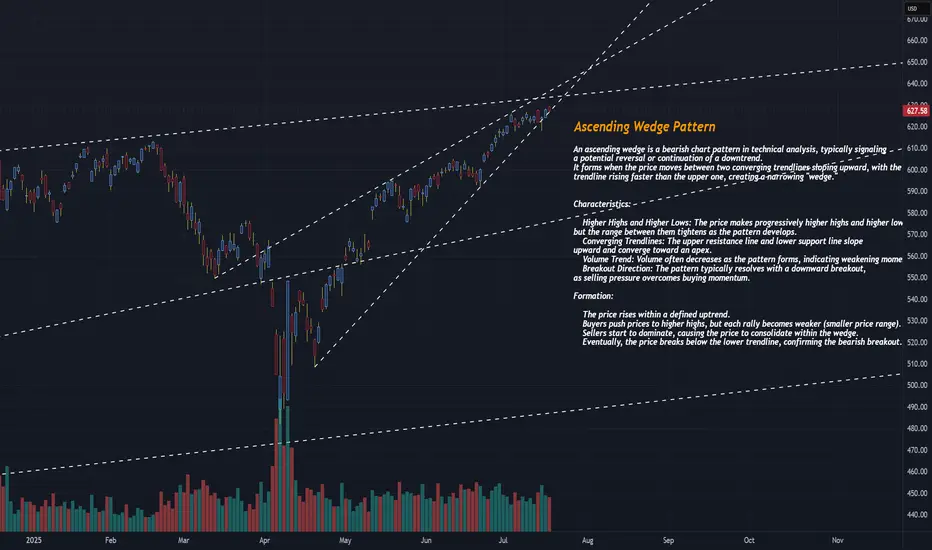
An ascending wedge (or rising wedge) is a bearish chart pattern formed when the price consolidates between two upward-sloping trendlines that converge over time. The upper trendline (resistance) connects higher highs, and the lower trendline (support) connects higher lows, creating a narrowing price range. This pattern typically indicates that bullish momentum is weakening, as buyers are pushing prices higher but with diminishing strength, often leading to a breakdown below the lower trendline.
Key characteristics of an ascending wedge include:
Converging Trendlines: Both the support and resistance lines slope upward, with the support line often steeper than the resistance line.
Decreasing Volume: Trading volume typically declines as the pattern forms, reflecting reduced buying conviction. A spike in volume often accompanies a breakout or breakdown.
Bearish Implication: In an uptrend, the ascending wedge signals a potential reversal to the downside. In a downtrend, it may act as a continuation pattern, but the bearish bias remains.
Breakout Confirmation: A convincing break below the lower trendline, preferably with increased volume, confirms the bearish reversal. A retest of the broken support (now resistance) may occur before further declines.
The pattern typically forms over 3–4 weeks but can appear on shorter timeframes like the 30-minute chart, making it relevant for intraday or short-term traders.investopedia.comen.wikipedia.org
SPY’s Current Ascending Wedge on the 30-Minute Chart
Given that SPY is in an ascending wedge on the 30-minute chart, we can infer the following based on recent posts on X and general technical analysis principles:
Pattern Context:
The ascending wedge suggests SPY has been making higher highs and higher lows in a tightening range, indicating a potential exhaustion of the bullish trend.
Recent posts on X (e.g., @AskPerplexity on July 16, 2025) noted a rising wedge in SPY with a breakdown through the lower trendline, suggesting bearish momentum. Another post (@YakshuMadaan on July 15, 2025) mentioned a wedge breaking below 6220, targeting 6050 on the S&P 500 index ( SPX), which correlates to SPY levels around $605–$610.
Key Levels to Watch:
Lower Trendline (Support): The critical level to monitor is the lower trendline of the wedge, which connects the higher lows. A decisive break below this level (e.g., a close below on the 30-minute chart with strong volume) signals a bearish breakdown and potential selloff. Based on recent X posts, this level may have been around $622 (equivalent to ~6220 onSPX) recently, but you should confirm the exact level on the current chart.
Upper Trendline (Resistance): The upper trendline connects the higher highs and acts as resistance. If SPY fails to break above this level, it reinforces the bearish bias. This could be near recent highs, potentially around $630–$635, depending on the chart’s progression.
Support Zones Post-Breakdown: If the lower trendline breaks, key support levels to watch include:
$590–$600: A post on X highlighted this as a major support zone based on volume profile analysis, likely corresponding to a prior consolidation area or gap fill.
$605–$610: Another post suggested a target of 6050 onSPX, translating to roughly $605–$610 for SPY, aligning with a significant retracement level.
Retest Level: After a breakdown, the price may retest the broken lower trendline (now resistance). For example, if the breakdown occurs at $622, a retest could see SPY rally back to $622–$625 before resuming the decline.ig.com
Volume and Indicators:
Volume: Look for declining volume as the wedge forms, followed by a spike on the breakdown to confirm the move. Low volume during the wedge suggests waning bullish momentum.xs.com
Relative Strength Index (RSI): An RSI above 70 near the upper trendline or showing bearish divergence (lower RSI highs while price makes higher highs) strengthens the case for a selloff.xs.com
Moving Average Convergence Divergence (MACD): A bearish crossover (MACD line crossing below the signal line) near the upper trendline can confirm weakening momentum.xs.com
Potential Selloff Triggers:
A close below the lower trendline on the 30-minute chart, especially with a spike in volume, is the primary trigger for a selloff. For example, a break below $622 (if that’s the current support) could initiate a move toward $605–$610 or lower to $590–$600.
A failed retest of the broken trendline (e.g., SPY rallies to $622–$625 after breaking down but fails to reclaim the trendline) would confirm bearish continuation.
Broader Market Context: Recent X posts suggest market concerns about macroeconomic factors (e.g., interest rate fears, policy shifts) could amplify a selloff, especially if technical levels break.
What is an Ascending Wedge Pattern?
An ascending wedge (or rising wedge) is a bearish chart pattern formed when the price consolidates between two upward-sloping trendlines that converge over time. The upper trendline (resistance) connects higher highs, and the lower trendline (support) connects higher lows, creating a narrowing price range. This pattern typically indicates that bullish momentum is weakening, as buyers are pushing prices higher but with diminishing strength, often leading to a breakdown below the lower trendline.
Key characteristics of an ascending wedge include:
Converging Trendlines: Both the support and resistance lines slope upward, with the support line often steeper than the resistance line.
Decreasing Volume: Trading volume typically declines as the pattern forms, reflecting reduced buying conviction. A spike in volume often accompanies a breakout or breakdown.
Bearish Implication: In an uptrend, the ascending wedge signals a potential reversal to the downside. In a downtrend, it may act as a continuation pattern, but the bearish bias remains.
Breakout Confirmation: A convincing break below the lower trendline, preferably with increased volume, confirms the bearish reversal. A retest of the broken support (now resistance) may occur before further declines.
The pattern typically forms over 3–4 weeks but can appear on shorter timeframes like the 30-minute chart, making it relevant for intraday or short-term traders.investopedia.comen.wikipedia.org
SPY’s Current Ascending Wedge on the 30-Minute Chart
Given that SPY is in an ascending wedge on the 30-minute chart, we can infer the following based on recent posts on X and general technical analysis principles:
Pattern Context:
The ascending wedge suggests SPY has been making higher highs and higher lows in a tightening range, indicating a potential exhaustion of the bullish trend.
Recent posts on X (e.g., @AskPerplexity on July 16, 2025) noted a rising wedge in SPY with a breakdown through the lower trendline, suggesting bearish momentum. Another post (@YakshuMadaan on July 15, 2025) mentioned a wedge breaking below 6220, targeting 6050 on the S&P 500 index (
Key Levels to Watch:
Lower Trendline (Support): The critical level to monitor is the lower trendline of the wedge, which connects the higher lows. A decisive break below this level (e.g., a close below on the 30-minute chart with strong volume) signals a bearish breakdown and potential selloff. Based on recent X posts, this level may have been around $622 (equivalent to ~6220 on
Upper Trendline (Resistance): The upper trendline connects the higher highs and acts as resistance. If SPY fails to break above this level, it reinforces the bearish bias. This could be near recent highs, potentially around $630–$635, depending on the chart’s progression.
Support Zones Post-Breakdown: If the lower trendline breaks, key support levels to watch include:
$590–$600: A post on X highlighted this as a major support zone based on volume profile analysis, likely corresponding to a prior consolidation area or gap fill.
$605–$610: Another post suggested a target of 6050 on
Retest Level: After a breakdown, the price may retest the broken lower trendline (now resistance). For example, if the breakdown occurs at $622, a retest could see SPY rally back to $622–$625 before resuming the decline.ig.com
Volume and Indicators:
Volume: Look for declining volume as the wedge forms, followed by a spike on the breakdown to confirm the move. Low volume during the wedge suggests waning bullish momentum.xs.com
Relative Strength Index (RSI): An RSI above 70 near the upper trendline or showing bearish divergence (lower RSI highs while price makes higher highs) strengthens the case for a selloff.xs.com
Moving Average Convergence Divergence (MACD): A bearish crossover (MACD line crossing below the signal line) near the upper trendline can confirm weakening momentum.xs.com
Potential Selloff Triggers:
A close below the lower trendline on the 30-minute chart, especially with a spike in volume, is the primary trigger for a selloff. For example, a break below $622 (if that’s the current support) could initiate a move toward $605–$610 or lower to $590–$600.
A failed retest of the broken trendline (e.g., SPY rallies to $622–$625 after breaking down but fails to reclaim the trendline) would confirm bearish continuation.
Broader Market Context: Recent X posts suggest market concerns about macroeconomic factors (e.g., interest rate fears, policy shifts) could amplify a selloff, especially if technical levels break.
Trade active
📉 SPY TECHNICAL BRIEFTicker:
Pattern in Play: Ascending Wedge Breakdown
🧭 Chart Overview:
SPY had been climbing steadily within a long-term ascending wedge pattern, marked by higher highs and higher lows but with a narrowing price range. This classic technical setup has now broken to the downside, a move that often precedes corrective pressure or a full trend reversal.
⚙️ Pattern Mechanics
What’s Happening:
The price broke below the lower wedge trendline, a key support level, after months of grinding upward in a narrowing band.
Volume had been declining, confirming loss of momentum before the break.
This breakdown is a bearish signal indicating that buying pressure is weakening, and sellers are taking control.
Pattern Characteristics Recap:
Higher Highs / Higher Lows: Confirmed during the uptrend.
Tightening Range: Suggests exhaustion.
Volume Divergence: Lower volume during uptrend = bearish divergence.
Break Direction: Usually resolves downward, which just occurred.
🔎 Key Levels to Watch
Type Price Levels Notes
Support 618–620 Recently lost trendline support. Watch for bear flag formation here.
590–600 Horizontal demand zone. Prior consolidation; potential bounce zone.
560–570 Major prior support (2023–2024 pivot area). Key for long-term trend holding.
Resistance 637–640 Rejected near wedge apex. Now overhead resistance.
628–630 Breakdown retest zone. Weak rally here could confirm lower highs.
⚠️ Technical Outlook & Risk Assessment
Short-Term:
Breakdown suggests short-term weakness. Expect increased volatility as markets digest macro data and earnings results. Watch 618–620 closely; further weakness could accelerate toward 590 quickly.
Near-Term:
If the wedge break confirms with a retest failure near 628–630, expect a deeper pullback toward the 590 zone, and possibly 560–570 in a full wedge target move.
Bearish Confirmation:
Multiple failed rallies with low volume and weak breadth could signal a shift to a broader correction phase.
🔮 Forward Outlook & Macro Factors
Risk Catalysts:
Rising Treasury yields
Sticky inflation or hawkish Fed commentary
Geopolitical escalations
Tech earnings (FAAMG-heavy SPX weighting)
Supportive Catalysts:
Fed pause or rate cut guidance
Positive surprise from mega-cap earnings
Rotation into defensive sectors (healthcare, utilities) stabilizing SPY
📌 Summary
SPY has officially broken down out of an ascending wedge, a historically bearish setup. While not yet catastrophic, this break below trend support implies the path of least resistance is now lower unless buyers step in quickly.
🔑 Key Confirmation Zone: If SPY fails to reclaim and hold above 628–630, the wedge breakdown gains credibility. Eyes on 590–600 next, with 560–570 as a deeper support area.
Stay tactical and manage risk. Wedge breaks don’t always result in crashes—but they do often lead to multi-leg corrections, especially when volume and sentiment diverge.
Disclaimer
The information and publications are not meant to be, and do not constitute, financial, investment, trading, or other types of advice or recommendations supplied or endorsed by TradingView. Read more in the Terms of Use.
Disclaimer
The information and publications are not meant to be, and do not constitute, financial, investment, trading, or other types of advice or recommendations supplied or endorsed by TradingView. Read more in the Terms of Use.