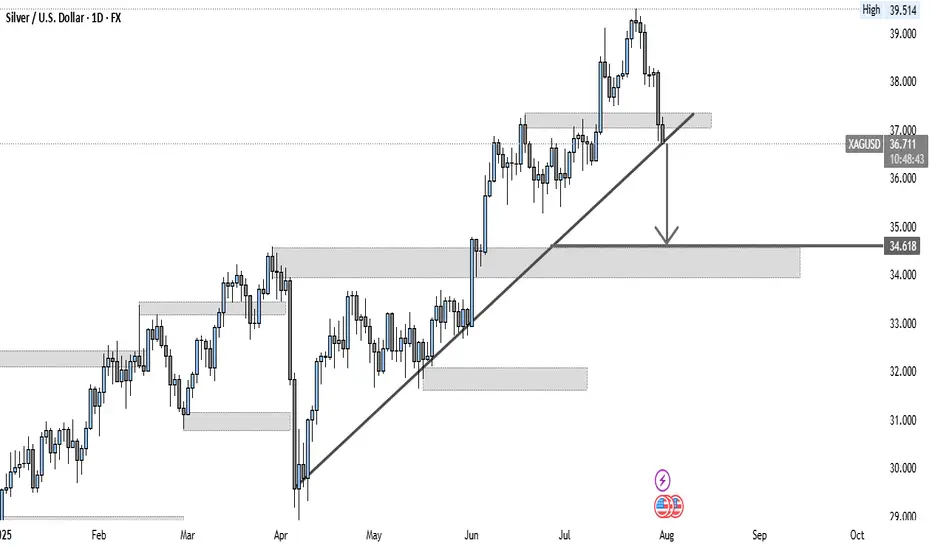
On the **daily chart**, XAGUSD has broken below its long-standing **ascending trendline**, indicating a potential shift from bullish momentum to a corrective phase.
### **Key Technical Highlights:**
1. **Trendline Break:** Price failed to hold above the rising trendline near **\$37.00**, which previously acted as dynamic support.
2. **Resistance Zone:** The broken trendline and the \$37.00 area now act as immediate resistance. Any retest could attract sellers.
3. **Support Target:** The next key support zone lies at **\$34.60-\$34.00**, which also aligns with a prior demand area.
4. **Lower High Structure:** The rejection from the recent high at **\$39.51** adds to the bearish bias.
### **Outlook:**
* As long as the price stays below **\$37.00**, momentum favors further downside towards **\$34.60-\$34.00**.
* If bulls reclaim **\$37.00** and close above it decisively, a recovery towards **\$38.50-\$39.00** could be seen, but that’s less likely at this stage.
### **Trading Plan:**
* **Bearish Scenario:** Look for short opportunities on retests of **\$37.00**, targeting **\$34.60-\$34.00**.
* **Bullish Scenario:** Only valid if price reclaims the broken trendline and closes back above **\$37.00**, invalidating the breakdown.
Trade active
JOIN MY FREE FOREX & GOLD SIGNALS TELEGRAM CHANNEL
t.me/+wX1pwTyx-0VmODI0
USER𝐍AME. @XKing05
t.me/+wX1pwTyx-0VmODI0
EXNESS BROKER : one.exnesstrack.net/a/iok5e2yuvx
t.me/+wX1pwTyx-0VmODI0
USER𝐍AME. @XKing05
t.me/+wX1pwTyx-0VmODI0
EXNESS BROKER : one.exnesstrack.net/a/iok5e2yuvx
Disclaimer
The information and publications are not meant to be, and do not constitute, financial, investment, trading, or other types of advice or recommendations supplied or endorsed by TradingView. Read more in the Terms of Use.