XAG/USD (Silver) - Triangle Breakout (09.07.2025)The XAG/USD (Silver) pair on the M30 timeframe presents a Potential Buying Opportunity due to a recent Formation of a Wedge Breakout Pattern. This suggests a shift in momentum towards the upside and a higher likelihood of further advances in the coming hours.
Possible Long Trade:
Entry: Consider
About Silver / U.S. Dollar
Silver Prices have been followed for centuries. Silver (XAG) is a precious metal used in jewelry, silverware, electronics, and currency. Silver prices are widely followed in financial markets around the world. Silver has been traded for thousands of years and was once used for currency backing. Silver continues to be one of the most commonly traded commodities today. Silver prices are highly volatile due to speculation and supply and demand. Ag is the chemical symbol for silver on the periodic table of elements and its ISO currency symbol is XAG.

Silver Analysis – Strong Bulls and a Clean Setup AheadLast month, Silver printed a new multi-decade high, a major technical milestone.
Since then, price has entered a sideways consolidation, forming a rectangle — but what stands out is this:
👉 Silver bulls have absorbed every dip, even when Gold dropped.
That’s strength. And strength usually precedes

SILVER Will Go Lower From Resistance! Short!
Here is our detailed technical review for SILVER.
Time Frame: 12h
Current Trend: Bearish
Sentiment: Overbought (based on 7-period RSI)
Forecast: Bearish
The market is approaching a significant resistance area 3,654.7.
Due to the fact that we see a positive bearish reaction from the underlined ar

Setupsfx_ | SILVER: Preparing For Another Bullish Move! There are two buying areas we believe could reverse the price trend, which would be a significant move in silver price history. We may even see it go above $40 for the first time. Silver is becoming a secondary best option to invest in the global market, but it will never surpass gold at least for n

SILVER (XAGUSD): Correction is Over?!
It looks like Silver has finally completed a consolidation within
a wide horizontal parallel channel on a daily.
A new higher high formation today indicates coming growth.
Because if its Friday, I suggest looking for trend-following buy from Monday.
Let the market close above the underlined res

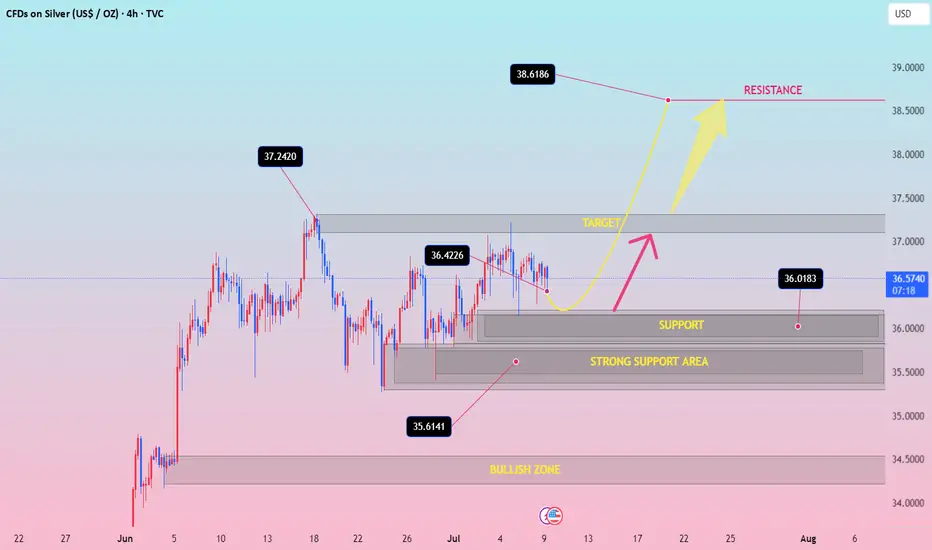
Silver set to break Higher? chart patterns suggest big moveSilver has been stuck in a sideways range for nearly a month, but a breakout may be near. A large ascending triangle hints at a possible move toward 41.37. Depending on how the market reacts, traders could aim for short-term targets with a 2.75 to 5.87 reward ratio or ride it longer for a potential

SILVER h4 bullish pattansilver bullish mode Bearish Disruption Scenario:
Fake bounce to ~$37.00
Rejection → Break $36.00 support
Bear momentum pushes to $35.00–34.50
Neutral/Range Disruption:
Price oscillates between 36.00 and 36.80 for longer than expected — builds up coiled energy before either sharp breakout or br
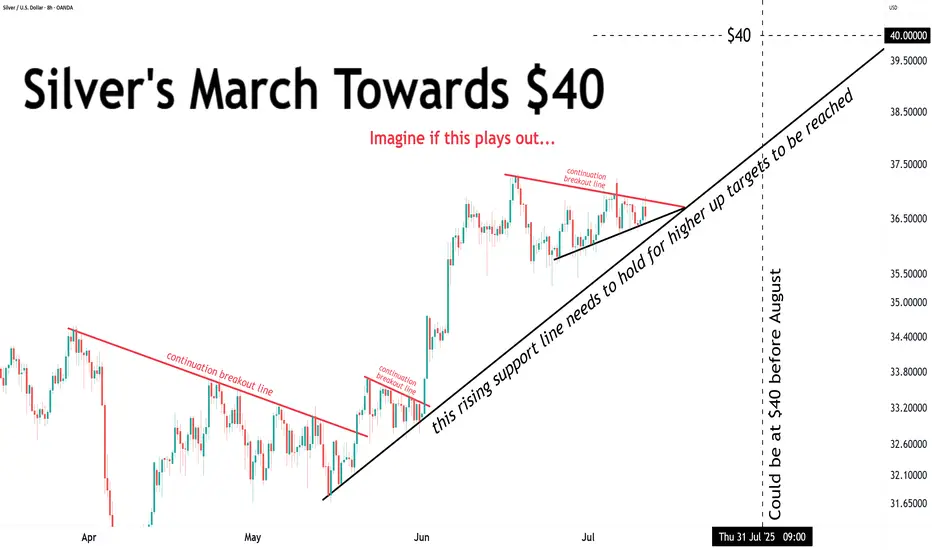
The anvil is tightening... The anvil is tightening...
Approaching a resolution which will answer the question:
"Will silver hit $40 before August?"
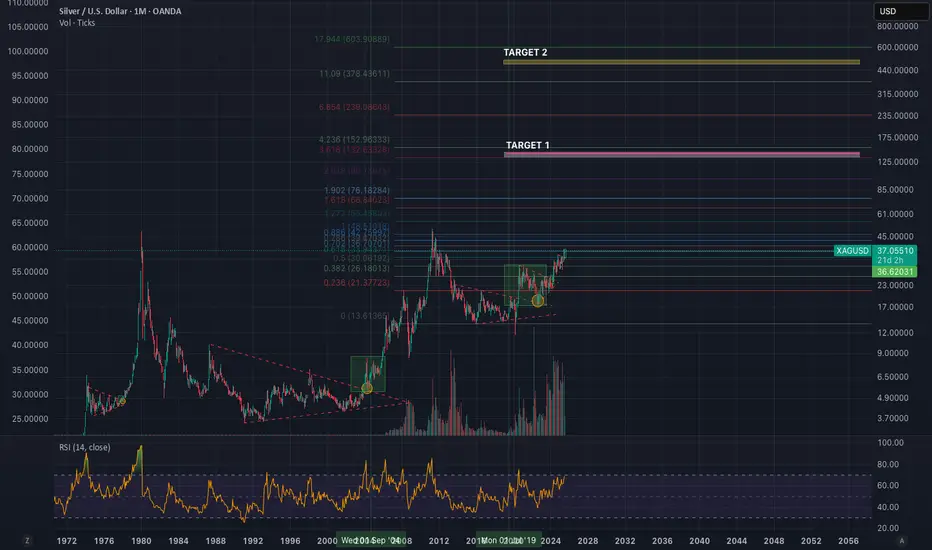
Silver Spot to $136/oz then $477/ozThis could take multiple years to play out, my gold call 2-3 years ago was dead on. All I'm using are multi-fib confluences and the assumption that currency debasement and global liquidity will continue to increase over time. I am riding silver for the long haul. Watch Gold and for DXY bottoming pat
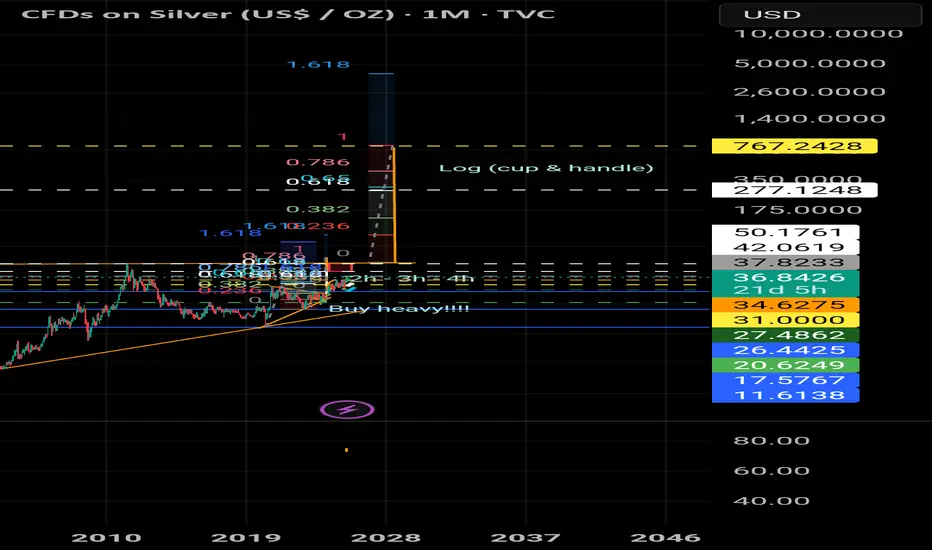
XAGUSD ~750 USD!?Hello. SILVER is approaching the cap of a multi-decade 'cup and handle' pattern. The measured move from that pattern reaches ~750USD/oz. GOLD has already reached the capping line of the 'cup and handle' and has continued up. Silver is known to lag Gold and outperform in the end. Position wisely my b
See all ideas
Displays a symbol's price movements over previous years to identify recurring trends.