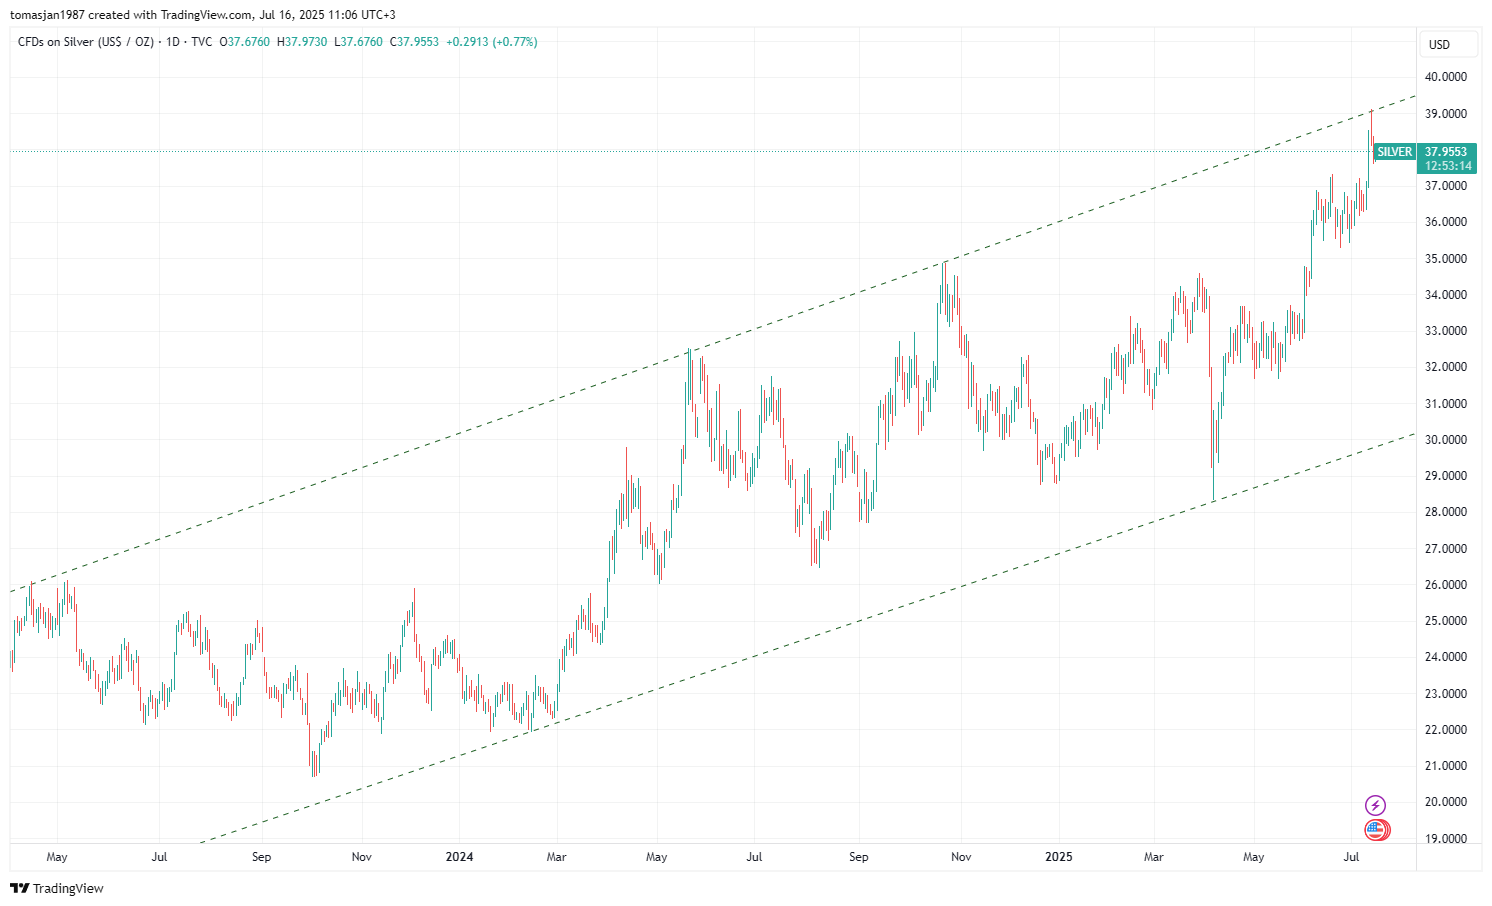
Silver / U.S. Dollar forum


You can follow us for more Analysis(Images and Videos) with Precise definition of the Financial Market.
Entry 📈 : "The heist is on! Wait for the MA breakout (32.800) then make your move - Bullish profits await!"
however I advise to Place Buy stop orders above the Moving average (or) Place buy limit orders within a 15 or 30 minute timeframe most recent or swing, low or high level for Pullback entries.
📌I strongly advise you to set an "alert (Alarm)" on your chart so you can see when the breakout entry occurs.
Stop Loss 🛑: "🔊 Yo, listen up! 🗣️ If you're lookin' to get in on a buy stop order, don't even think about settin' that stop loss till after the breakout 🚀. You feel me? Now, if you're smart, you'll place that stop loss where I told you to 📍, but if you're a rebel, you can put it wherever you like 🤪 - just don't say I didn't warn you ⚠️. You're playin' with fire 🔥, and it's your risk, not mine 👊."
📍 Thief SL placed at the recent/swing low level Using the 2H timeframe (31.700) Day trade basis.
📍 SL is based on your risk of the trade, lot size and how many multiple orders you have to take.
🏴☠️Target 🎯: 33.900 (or) Escape Before the Target

📉 XAG/USD – Rising Wedge Breakdown Signals Bearish Reversal Setup
🕒 Timeframe: 1-Hour (H1)
📅 Chart Date: April 14, 2025
🔍 Pattern Identified: Rising Wedge
The current chart presents a textbook Rising Wedge pattern, a classic bearish reversal formation that often appears after a bullish trend. It’s characterized by higher highs and higher lows, but with converging trendlines—indicating weakening bullish momentum. Eventually, a breakdown from the lower wedge support confirms a bearish move.
📊 Key Technical Elements:
Rising Wedge Formation:
Price gradually climbed within a narrowing structure. The upward movement lacked strong volume or impulsiveness, which is a typical sign of fading bullish strength.
Resistance Zone:
The top of the wedge coincided with a horizontal resistance area around 33.55 – 33.60, where the price failed to break multiple times. This level is marked as a significant supply zone.
Breakdown Confirmation:
The price broke below the rising wedge’s lower boundary, confirming the bearish reversal. The breakdown candle was strong, indicating potential participation from institutional sellers or trend followers.
Support Area Targeting:
The first profit target (TP1) is positioned at $31.35, aligned with previous structure support.
The final target (TP2) is near $30.29 – $30.32, a key demand zone and potential rebound area.
Stop Loss (SL):
The SL is logically placed above the most recent swing high and above the resistance zone (~$33.58), which invalidates the bearish setup if price closes above.
📐 Trade Setup Summary:
Parameter Level
Pattern Rising Wedge (Bearish)
Entry Trigger Break and close below wedge support
Stop Loss (SL) Above $33.58
TP1 $31.35
TP2 $30.29–$30.32
Bias Bearish (Short Setup)
Risk-Reward Favorable (1:2 or better)
🧠 Trading Psychology Insight:
This setup reflects a transition of control from buyers to sellers. Initially, buyers pushed price higher, but with each successive high, momentum weakened. The tight consolidation within the wedge hints at distribution, and once the support gave way, sellers stepped in with conviction. This offers traders a clean technical setup with a strong risk management profile.
🔍 Additional Confluence:
Rising wedge near a major horizontal resistance.
Bearish price action confirmation post-breakdown.
Volume drop during the wedge formation (if included) and spike on breakdown—classic signal.
Clean lower highs forming post-break, indicating trend continuation.
