How Can You Use the Ascending Triangle in Trading?How Can You Use the Ascending Triangle in Trading?
An ascending triangle is a chart pattern traders rely on to identify potential breakouts and further price movements. Recognised for its versatility, this pattern can signal trend continuations across all types of markets, including stocks, forex, commodities, and cryptocurrencies*. In this article, we’ll break down how to spot and trade this formation.
What Is an Ascending Triangle?
An ascending or rising triangle is a bullish chart pattern that usually signals a trend continuation. It is framed by two trendlines. The upper line connects highs placed at almost the same level, while the lower line is angled and connects higher lows.
The triangle’s appearance is explained as follows: buyers try to push the price up, but they meet a strong resistance level, so the price rebounds. Still, buyers have strength, which is reflected in higher lows. Therefore, they continue pushing the price until it breaks above the resistance level. The period during which the price bounces back and forth between the two lines depends on the timeframe. On daily charts, the triangle can be in place for over a week.
Note: The ascending triangle is a continuation chart pattern but sometimes it can be used as a reversal signal. It happens when the ascending triangle occurs in a downtrend. It’s the biggest challenge of all the triangles.
The rising triangle is one of the setups in the triangle group. There are also descending and symmetrical formations.
Ascending, Descending, and Symmetrical Triangles: The Differences
The triangle group of patterns comprises ascending, descending, and symmetrical formations.
The ascending triangle is a bullish formation and the descending triangle is bearish. At the same time, the symmetrical triangle is a bilateral setup that signals a rise and a fall in the price.
To distinguish between them, traders draw trendlines. In a rising triangle pattern, an upper trendline is horizontal and connects equal or almost equal highs, while the lower trendline is rising as it connects higher lows. In a descending or falling triangle pattern, the lower trendline is horizontal and connects equal or almost equal lows, while the upper trendline declines, going through lower highs. A symmetrical triangle has a falling upper line that connects lower highs and a rising lower line that connects upper lows.
How Traders Spot the Ascending Triangle
It’s quite easy to identify the formation on a chart. Still, there are a few rules that may help a trader determine its strength.
- The trend strength. Although the setup may appear on any timeframe, traders look for strong long-term trends as risks of a fakeout on low charts are higher.
- Consolidation. Triangles appear when the market consolidates within an overall trend.
- Trendlines. Trendlines must be drawn through at least two points. Still, the larger the number of points, the higher the possibility the setup works.
- Breakout. Can the ascending triangle pattern be bearish? No. It is a bullish formation that appears in a bullish and a bearish trend but always signals a potential price rise.
How Can You Trade Ascending Triangles?
The rising triangle pattern is usually considered a continuation setup formed in an uptrend. Still, if the ascending triangle is in a downtrend, it may signal a trend reversal. The trading rules will be the same in both cases.
As with most chart patterns, triangles have specific rules that help traders place entry and exit points.
Entry
The theory suggests trades go long when the price breaks above the setup's upper boundary. In a conservative approach, traders wait for the price to form at least several candles before entering the market. In a risky strategy, traders open a position as soon as the breakout occurs, and the breakout candlestick closes.
It's worth considering trading volumes as breakouts often turn into fakeouts, meaning the market returns to its previous trend. The chance of a strong breakout is higher if the volumes are high.
However, increased volumes aren't the only tool used to confirm a breakout. Many traders consider trend indicators and oscillators to potentially limit the risks of bad trading decisions.
- If the triangle serves as a continuation setup, it may be helpful to look at the signals of trend-strength indicators, including the average directional index.
- If traders use the ascending triangle as a reversal setup, they usually implement indicators that may signal a trend reversal, including the moving average, the relative strength index, the moving average convergence divergence, and the stochastic oscillator.
Take Profit
A standard take-profit target equals the size of the largest part of the setup and is measured just from the breakout trendline.
Stop Loss
Traders consider several options when placing stop-loss levels. In a conservative approach, they implement the risk/reward ratio, which is usually 1:2 or 1:3 but depends on the trader's willingness to take risks. Also, traders utilise the upper trendline as a threshold and place the stop-loss order just under it.
Note: These are general rules. However, traders can develop their own trading strategies and adjust the pattern's parameters and rules according to their trading approach.
Ascending Triangle: Strategy
In this strategy, traders observe an existing bullish trend and the formation of an ascending triangle, which suggests the potential for a continuation pattern. Incorporating a short-term moving average, such as a 9-period EMA, provides dynamic support, aligning with the trendline to strengthen the setup.
Entries
- Traders typically wait for the price to break through the top trendline of the ascending triangle.
- A strong candle breaking the resistance level adds confidence, though any move above the top trendline can serve as an entry signal.
- The price should also trade above the moving average, offering additional confirmation.
- An order is often placed at the top trendline, anticipating a retracement to this level, which now acts as support.
Stop Loss
- Traders place a stop-loss below the most recent swing low within the triangle.
- For more conservative traders, the stop may be set at any prior swing low, depending on risk tolerance.
Take Profit
- Many traders aim for a risk-reward ratio of 1:2 or 1:3.
- Profits might also be taken at the next strong resistance level, aligning with the market structure.
Rising Triangle: Benefits and Drawbacks
This formation has advantages and pitfalls that traders consider when developing their strategies.
Benefits
- It can be used on any timeframe. Triangles are formed on charts of any period. Still, they might be more effective if the setup appears in a solid trend on a high timeframe.
- It can be used for any asset. Another advantage is that the ascending triangle pattern is used for stock, commodity, cryptocurrency*, and Forex trading.
- Easy to spot. A trader only needs to draw two trendlines to define this setup on the chart.
- Exact entry and exit points. Although traders can develop their entry and exit points, the setup assumes there are specific rules traders with any experience utilise.
Drawbacks
- It can confuse traders. As the rising triangle is used as a reversal and continuation formation, traders with less experience may be confused with its signals.
- False breakouts. The setup works when a price breakout occurs. However, there is a high risk the breakout will appear to be a fakeout, and the price will return.
- The pattern may fail. Aside from a fakeout, there is another risk when trading with triangles. The price may break another side of the formation, and the formation will fail.
- The trading rules may not work. Although specific rules indicate where a trader should place entry and exit points, buyers may be too weak to push the price to the take-profit target.
Final Thoughts
The ascending triangle is one of the more common chart patterns traders use when trading various assets. Still, there is no 100% guarantee that it will work every time you spot it on a price chart. It's vital to remember that every signal must be confirmed with other indicators, chart patterns, and candlesticks. Also, it's a well-known fact that any trade involves risks that should be considered every time a trader enters the market. Improve your skills by practising on different assets and timeframes.
FAQ
How Do You Form an Ascending Triangle?
An ascending triangle is formed when the price action creates a series of higher lows while facing a resistance level, resulting in a horizontal upper trendline and a rising lower trendline. The price consolidates between these two lines before potentially breaking out above the resistance, signalling a bullish continuation.
Is an Ascending Triangle Bullish or Bearish?
The ascending triangle is a bullish pattern. It suggests that buyers are gaining strength as higher lows form, increasing the likelihood of a breakout above the resistance level. There is a descending triangle pattern that usually appears in a downtrend, signalling a downward movement.
How to Enter an Ascending Triangle?
According to the theory, in triangle pattern trading, it’s common to enter the market when the price breaks above the upper trendline of the triangle. In a conservative approach, traders wait for confirmation through several closing candles after the breakout. The increased volume also adds confidence to the trade.
What Is the Ascending Triangle Pattern Retest?
A retest occurs when the price breaks out of the triangle but then briefly falls back to test the former resistance level. A successful retest confirms the breakout and can provide an additional entry point.
How Long Does an Ascending Triangle Pattern Take to Form?
The formation of a bullish triangle pattern can vary based on the timeframe. On daily charts, it can take several days to weeks, while on shorter timeframes, it might form within hours.
What Is the Difference Between an Ascending Triangle and a Rising Wedge?
In comparing the ascending triangle vs. the rising wedge, it’s key to recognise that the rising wedge has converging trendlines, signalling a possible weakening trend, often leading to a bearish reversal. In contrast, an ascending triangle trading pattern typically signals a continuation of the uptrend.
*At FXOpen UK, Cryptocurrency CFDs are only available for trading by those clients categorised as Professional clients under FCA Rules. They are not available for trading by Retail clients.
This article represents the opinion of the Companies operating under the FXOpen brand only. It is not to be construed as an offer, solicitation, or recommendation with respect to products and services provided by the Companies operating under the FXOpen brand, nor is it to be considered financial advice.
Ascending Triangle
Triangle Chart Patterns: How to Identify and Trade ThemTriangle Chart Patterns: How to Identify and Trade Them
Triangle chart patterns are essential tools in technical analysis, helping traders identify potential trend continuations. These formations build as the price consolidates between converging trendlines, signalling an upcoming move in the market. In this article, we’ll explore the three types of triangle patterns—symmetrical, ascending, and descending—and how traders use them to analyse price movements.
What Are Triangle Chart Patterns?
Triangle chart patterns are a common tool used to understand price movements in the market. These patterns form when the price of an asset moves within two converging trendlines, creating a triangle shape on a chart. The lines represent support and resistance levels, and as they get closer together, it signals a potential breakout in one direction.
Symmetrical, ascending, and descending are three types of triangle patterns. Each of these patterns reflects a different market sentiment, with symmetrical triangles showing indecision, ascending triangles suggesting a bullish bias, and descending triangles hinting at bearish momentum. These formations are useful because they help traders spot potential breakouts, where the price might move sharply up or down after a period of consolidation.
It’s important to note that triangles and wedge patterns are similar but not the same. Both patterns involve converging trendlines, but wedges tend to slope upward or downward. Triangles, on the other hand, either feature one horizontal trendline and a sloping trendline or two sloping trendlines at roughly the same angle.
Below, we’ll cover the three triangle types. If you’d like to follow along, head over to FXOpen and TradingView to get started with real-time charts.
Symmetrical Triangle
The symmetrical triangle is a popular chart pattern that shows up when the price of an asset starts consolidating within a tighter range. Unlike other triangle patterns, it doesn’t lean heavily in either direction—bullish or bearish—making it a neutral signal. It forms when buyers and sellers are in a bit of a standoff, with no clear trend in sight. However, this period of indecision often leads to a significant move once the price breaks out of the pattern.
What Does It Look Like?
- Two converging trendlines;
- One sloping down from the highs (resistance);
- One sloping up from the lows (support);
- The price oscillates between these two lines, forming lower highs and higher lows;
- The formation narrows as the lines get closer together, creating a point of breakout.
What Does It Indicate?
A symmetrical triangle pattern indicates a period of indecision in the market. Buyers and sellers are evenly matched, causing the price to move within a narrowing range. As it gets smaller, the pressure builds, and the price is likely to break out either up or down. Since the formation is neutral, the breakout could occur in either direction, and traders wait for this moment to see where the market is heading.
How Do Traders Use It?
Traders typically watch for a breakout from the symmetrical triangle to signal the next significant price movement. They often look for an increase in trading volume alongside the breakout, as this can confirm the strength of the move. In most cases, it’s used as a signal for potential price continuation. However, some traders see it as a reversal indicator, depending on what the preceding trend looks like.
Ascending Triangle
An ascending triangle is a bullish triangle pattern that’s often looked for when analysing potential price breakouts. It usually forms during an uptrend but may also appear in a downtrend. It suggests that buyers are becoming more aggressive, while sellers are struggling to push the price lower, creating a situation where the market might break upwards.
What Does It Look Like?
- A horizontal resistance line at the top (price struggles to break above this level);
A rising trendline at the bottom, connecting higher lows (buyers are stepping in earlier each time);
- The price moves between these two lines, creating a triangle shape;
- The formation narrows over time, putting pressure on the resistance level.
What Does It Indicate?
An ascending triangle pattern signals that buyers are gaining control. While the price keeps hitting a ceiling (resistance), the higher lows show that the market’s buying pressure is increasing. This often leads to a breakout above the resistance level, where the price can make a significant upward move. Traders usually see this formation as a sign that the market is primed for a continuation of the current uptrend. However, sometimes it can appear in a downtrend and signal a trend reversal.
How Do Traders Use It?
Traders typically use the ascending triangle to spot potential breakouts above the resistance level. When the price finally moves and closes above this line, it’s seen as confirmation that the upward trend is continuing. Many also pay close attention to the trading volume during this breakout—rising volume can confirm that the breakout is genuine.
In some cases, the price may break through the resistance quickly, while in others, it could take time before the upward move happens. There may also be false breakouts before the true bullish move occurs, with the price typically closing below resistance.
Descending Triangle
A descending triangle is a bearish chart pattern that signals potential downward movement in the market. It typically forms during a downtrend but can also appear in an uptrend. It shows that sellers are becoming more dominant, while buyers are struggling to push the price higher, which could lead to a breakdown below a key support level.
What Does It Look Like?
- A horizontal support line at the bottom (price struggles to break below this level);
- A descending trendline at the top, connecting lower highs (sellers are pushing the price down);
- The price moves between these two lines, creating a triangle shape;
- The formation narrows over time, with the pressure building on the support level.
What Does It Indicate?
A descending triangle chart pattern suggests that sellers are in control. While the price holds at the support level, the series of lower highs shows that selling pressure is increasing. This often leads to a breakdown below the support line, where the price might experience a sharp decline. Traders see the formation as a bearish signal, indicating that the market could continue its downward trend.
How Do Traders Use It?
Traders typically use the descending triangle to identify potential breakdowns below the support level. When the price falls and closes below this line, it’s considered confirmation that the sellers have taken over and that further downside movement could follow.
Similar to other triangle patterns, it’s common to watch for a rise in trading volume during the breakdown, as it can confirm the strength of the move. It’s also possible to see false breakouts below the support level when the price closes back inside the pattern almost immediately.
How Traders Use Triangle Patterns in Technical Analysis
These patterns are just one piece of the puzzle in technical analysis, but they can offer us valuable insights when used correctly.
Triangle Pattern Trading: Entry, Stop-Loss, and Profit Targets
Entry Points
Traders typically wait for a confirmed breakout from the triangle formation’s boundaries before entering a trade. For ascending triangles, this means watching for the price to break above the upper trendline (resistance), while for descending triangles, they look for a breakdown below the lower trendline (support). In a symmetrical triangle, the breakout may be in either direction, usually informed by the broader market trend.
The entry is often confirmed by a closing candle above or below these key levels to reduce the risk of false breakouts.
Stop-Loss Placement
Stop-loss orders are crucial here. For ascending triangles, stop losses might be placed just below the last swing low, while for descending triangles, they might be set just above the recent swing high. In the case of symmetrical triangles, traders often place the stop-loss just outside the formation’s apex.
Profit Targets
To set profit targets, traders typically use the triangle's height (the distance between the highest and lowest points). This height is then projected from the breakout point, offering a realistic target for the trade. For example, if a triangle stock pattern’s height is $10 and the breakout occurs at $50, the target would be $60 for a bullish move.
Combining with Market Context
Triangles may become more reliable when considered in the context of the broader market environment. Traders don’t just look at the pattern in isolation—they analyse the prevailing trend, market sentiment, and even macroeconomic factors to gauge whether a breakout aligns with the larger market movement. For instance, an ascending formation in a strong uptrend adds confidence to the idea of a bullish breakout.
Using Other Indicators for Confirmation
While triangles provide a useful framework, they’re usually combined with other technical indicators for confirmation. Traders often align triangles with volumes, moving averages, or momentum indicators to assess whether the breakout has strong support behind it. For instance, a breakout confirmed by high volume or a moving average crossover might add confluence to the trade.
Limitations and Considerations of Triangle Patterns
Triangles are useful tools in technical analysis, but they come with limitations and important considerations. While they can signal potential breakouts, it’s essential to approach them cautiously.
- False Breakouts: Triangles often experience false breakouts, where the price briefly moves beyond the trendline but quickly reverses. This may trap traders in unfavourable positions.
- Subjectivity: These formations are open to interpretation. Different people may draw trendlines slightly differently, leading to varying conclusions about where the breakout occurs.
- Need for Confirmation: Relying solely on patterns can be risky. They may work better when combined with other indicators, such as volume or moving averages, to confirm the trend direction.
- Market Conditions: In volatile or news-driven markets, chart patterns may not behave as expected, reducing their reliability. They may provide false signals or lose significance in these situations.
The Bottom Line
Triangle chart patterns are popular tools among those looking to analyse market movements and potential breakouts. Whether it’s a symmetrical, ascending, or descending triangle, these patterns provide valuable insights into price consolidation and future trends. While no pattern guarantees a winning trade, combining triangles with other indicators may improve market analysis.
Ready to apply your knowledge? Open an FXOpen account to explore chart patterns in more than 700 live markets and take advantage of our low-cost, high-speed trading environment backed by advanced trading platforms.
FAQ
What Is a Triangle Chart Pattern?
A triangle chart is a pattern in technical analysis that forms when the price of an asset moves between converging trendlines, creating a triangle shape on a price chart. They typically signal a period of consolidation before a strong potential breakout in price.
What Are the Patterns of Triangles?
There are three main types of triangles in chart patterns: symmetrical, ascending, and descending. Symmetrical triangles indicate indecision in the market while ascending triangles are often bullish, and descending triangles tend to be bearish.
How to Trade a Triangle?
Traders typically wait for a confirmed breakout from the triangle’s trendlines. According to theory, entry points are based on a breakout above resistance or below support, with stop-loss orders placed just outside the triangle. Profit targets are often set based on the height (the distance between the highest and lowest points) of the pattern.
What Is the Triangle Pattern Strategy?
The triangle pattern strategy involves waiting for a breakout and using the formation’s height to set profit targets. It’s combined with tools like volume, moving averages, and momentum indicators to confirm the move and avoid false breakouts.
Is the Triangle Pattern Bullish or Bearish?
They can be both bullish and bearish. Ascending triangles are generally seen before a bullish movement, descending triangles are bearish, and symmetrical triangles can be either.
This article represents the opinion of the Companies operating under the FXOpen brand only. It is not to be construed as an offer, solicitation, or recommendation with respect to products and services provided by the Companies operating under the FXOpen brand, nor is it to be considered financial advice.

Bitcoin Seasonality - Best Month (October) and Best Day (Monday)It's very important for every Bitcoin trader to know its seasonality because this will significantly increase the probability of successful trades. I have been trading Bitcoin for almost 10 years, and I successfully use seasonality patterns to predict Bitcoin price movements. For example, you don't want to go long on Bitcoin during August or September; that's probably a very bad idea. The biggest market crashes usually happen in September. But you definitely want to go long in October or April, as these months are the most promising. Knowledge of these patterns will give you an advantage over standard retail traders. Every trade matters.
Average return by Month (%)
January: +5.1%
February: +12.1%
March: +4.8%
April: ˇ+18.7%
May: +14.2%
June: +4.4%
July: +6.1%
August: -3.1%
September: -8.4%
October: +22.2%
November: +17.9%
December: +7.3%
Average return by Weekday (%)
Monday: +0.63%
Tuesday: +0.18%
Wednesday: +0.54%
Thursday: +0.40%
Friday: +0.37%
Saturday: +0.45%
Sunday: +0.10%
Currently I am bullish on Bitcoin as the price is in an uptrend and the bear market is not confirmed; I expect Bitcoin to hit 115k probably at the end of February. What I also expect is an alt season - alt season is starting right now! So it's time to buy some altcoins. Ethereum should outperform BTC in the next weeks as well.
Write a comment with your altcoin, and I will make an analysis for you in response. Also, please hit boost and follow for more ideas. Trading is not hard if you have a good coach! This is not a trade setup, as there is no stop-loss or profit target. I share my trades privately. Thank you, and I wish you successful trades!

ETH | Alternative Chart Pattern | EducationJust a short update for my latest C&H post
Price is also forming an Ascending Triangle pattern with a liquidity zone of $2,800 - $3,000 for an average spot for buyer to step in
When trading chart patterns it's best to figure out how to jump in before the breakout similarly to the last touches highlighted in blue on the bottom trendline
You can see that price was forming a bottom-like pattern or what I also like to call price accumulation and then vice versa for the tops.

Ascending Triangle in Nikkei/Yen Futures: A 2025 Bullish Setup?1. Introduction
The Nikkei/Yen Futures, a crucial instrument for traders aiming to capture movements in Japan’s equity index and its currency dynamics, presents an intriguing setup as we step into 2025. An ascending triangle pattern, a classic bullish formation, is emerging on the chart, signaling a potential breakout to the upside.
Adding to the technical allure is the depletion of sell unfilled orders (UFOs) within a significant price zone between 40,420 and 39,685. This critical area, revisited six times since late July 2024, has seen a steady reduction of unfilled sell orders, opening the possibility for bullish momentum to dominate. With the price currently hovering near the 39,685 level, the stage appears set for a breakout opportunity.
2. The Technical Setup
The ascending triangle, characterized by a series of higher lows converging toward a horizontal resistance level, often signifies bullish pressure. In the case of the Nikkei/Yen Futures, the horizontal resistance resides near 39,685, the lower boundary of a key sell UFO zone.
This resistance has been tested repeatedly since July 2024, with each revisit chipping away at the sell orders within the zone. Such behavior suggests diminishing selling pressure, setting the foundation for a breakout. The anticipated target for this breakout, calculated using Fibonacci projection, is set at 41,380—aligning with historical price action and technical projections.
Key Contract Specifications:
o Regular Nikkei/Yen Futures (NIY1!)
Contract Size: ¥500 x Nikkei 225 index
Tick Size: ¥5
Point Value: ¥2,500
Margin Requirement: Approx. $ 1,500,000 JPY
o Micro Nikkei/Yen Futures (MNI)
Contract Size: ¥50 x Nikkei 225 index
Tick Size: ¥5
Point Value: ¥250
Margin Requirement: Approx. $ 150,000 JPY
These details ensure accessibility for both institutional and retail traders, with the micro contract enabling smaller capital commitments while maintaining exposure to the same underlying asset.
3. Forward-Looking Trade Plan
The technical evidence supports a bullish trade plan for Nikkei/Yen Futures:
Trade Direction: Long
Entry Price: Above 39,685, confirming a breakout from the resistance level.
Target Price: 41,380, based on Fibonacci projections.
Stop Loss: 39,120, targeting a 3:1 reward-to-risk ratio to manage risk effectively.
Reward-to-Risk Ratio: 3:1 (Calculated: 41,380 - 39,685 = 1,695 reward; 39,685 - 39,120 = 565 risk).
The trade parameters apply to both the standard and micro contracts, offering flexibility in position sizing. Traders with smaller accounts may opt for the micro contract to manage margin requirements while engaging in this high-potential setup.
4. Importance of Risk Management
Risk management remains the cornerstone of any successful trading strategy, particularly when trading leveraged instruments like futures. Here are key considerations for managing risk in the Nikkei/Yen Futures trade setup:
Stop-Loss Orders: Placing a stop-loss at 39,120 ensures a predefined risk level, protecting traders from unexpected market reversals. It’s vital to adhere to this level to maintain discipline and avoid emotional decision-making.
Position Sizing: The availability of micro contracts (MNIY1!) allows traders to tailor their position size according to their account size and risk tolerance. For example, trading one micro contract involves a significantly smaller margin commitment compared to the regular contract, making it suitable for retail traders.
Defined Risk Exposure: Leveraged products like futures can lead to substantial losses if risk is not clearly defined. Using stop-loss orders and trading within calculated risk parameters prevents the potential for undefined losses.
Precise Entries and Exits: Setting the entry above 39,685 ensures a systematic approach to triggering the trade based on the expected breakout. Similarly, targeting 41,380 using Fibonacci projections ensures that profit objectives align with technical analysis rather than arbitrary levels.
By prioritizing these aspects, traders can mitigate risks while maximizing the potential reward from this bullish setup.
5. Closing Remarks
The Nikkei/Yen Futures seem to be poised for a potential breakout as we enter 2025, driven by a combination of technical factors and diminishing sell-side unfilled orders. The ascending triangle formation strengthens the bullish bias, with the calculated Fibonacci projection of 41,380 offering an attractive target.
Both the standard and micro contracts cater to different trader profiles, allowing participation regardless of account size. As the price approaches the critical 39,685 level, traders are encouraged to stay vigilant, using real-time CME data to track developments and validate entry triggers.
When charting futures, the data provided could be delayed. Traders working with the ticker symbols discussed in this idea may prefer to use CME Group real-time data plan on TradingView: www.tradingview.com - This consideration is particularly important for shorter-term traders, whereas it may be less critical for those focused on longer-term trading strategies.
General Disclaimer:
The trade ideas presented herein are solely for illustrative purposes forming a part of a case study intended to demonstrate key principles in risk management within the context of the specific market scenarios discussed. These ideas are not to be interpreted as investment recommendations or financial advice. They do not endorse or promote any specific trading strategies, financial products, or services. The information provided is based on data believed to be reliable; however, its accuracy or completeness cannot be guaranteed. Trading in financial markets involves risks, including the potential loss of principal. Each individual should conduct their own research and consult with professional financial advisors before making any investment decisions. The author or publisher of this content bears no responsibility for any actions taken based on the information provided or for any resultant financial or other losses.

Actual Success Rates of Ascending and Descending TrianglesActual Success Rates of Ascending and Descending Triangles
Here is an analysis of the actual success rates of ascending and descending triangles in trading, based on the information provided:
Success Rates
Ascending and descending triangles generally have fairly high success rates as continuation patterns:
-The ascending triangle has a success rate of approximately 72.77%.
-The descending triangle has a slightly higher success rate of 72.93%.
These numbers come from a study that tested over 200,000 price patterns over a 10-year period.
Factors Influencing Success
Several factors can influence the success rate of these patterns:
-The trader's ability to execute the strategy correctly
-Market conditions at the time the triangle formed
-Market liquidity
-Overall market sentiment
Important Points to Consider
-Triangles are considered reliable continuation patterns, especially in trending markets.
-The ascending triangle in an uptrend is statistically more reliable than the descending triangle.
-To validate the pattern, the price must touch at least twice each of the upper and lower lines.
-An increase in volume during the breakout is an important confirmation sign.
Strategies to improve the chances of success
-Wait for the triangle to fully form before entering a position1.
-Confirm the breakout with a close above/below the resistance/support level.
-Use additional technical indicators to confirm the signal.
-Pay attention to the volume, which should increase during the breakout.
Conclusion
Although ascending and descending triangles have relatively high success rates, it is important to use them in conjunction with other technical analysis tools and to take into account the overall market context to maximize the chances of success.

CHARTIST TRIANGLES: HOW DOES IT WORK? ANSWER is HERE!ASCENDING TRIANGLE:
Identify the levels where the price has often closed and opened (black line).
The price is making higher and higher lows.
Draw a bullish diagonal.
Take Profit is calculated by plotting the lowest increase on the black line (see graph).
Report this segment to the BREAK of the black line, but ESPECIALLY to the CLOSING of the candle in its time unit!!!
___________________________________________________
DESCENDING TRIANGLE:
Identify the levels where the price has often closed and opened (black line).
The price makes higher and lower highs.
Draw a bullish diagonal.
Take Profit is calculated by plotting the highest drop on the black line (see graph).
Report this segment to the BREAK of the black line, but ESPECIALLY to the CLOSING of the candle in its time unit!!!
___________________________________________________
SYMMETRICAL TRIANGLE:
The triangle of indecision, just like the RANGE!!
The price is tightening, and we don't know in which direction it's going PETER!!??
Draw a bullish and bearish diagonal.
Wait for a break in one of the diagonals.
The Take Profit is calculated by reporting the highest side of the rectangle which made a PULLBACK (see my old publication on "PULLBACK") and see graph below.
Report this segment to the BREAK of one of the diagonals, but ESPECIALLY to the CLOSING of the candle in its time unit!!!
STOP Loss below the previous low if you are BUYING.
STOP Loss above the previous high if you are SHORT (Seller).

4 Triangle Types You Need to KnowTriangle chart patterns offer valuable insights into market dynamics, symbolizing a clash between buyers and sellers within a contracting price range. These patterns are often classified as continuation or neutral patterns, suggesting that the price is likely to persist in its existing trend after the pattern concludes.
1. Symmetrical Triangle:
A symmetrical triangle manifests when the slope of the price's highs and lows converges, creating a triangular structure. This pattern signifies a period of consolidation, with lower highs and higher lows indicating equilibrium between buyers and sellers. As the slopes converge, a breakout becomes imminent, though the breakout direction remains uncertain.
To capitalize on a symmetrical triangle , consider placing entry orders above the slope of the lower highs and below the slope of the higher lows, prepared to ride the price in the direction of the breakout.
2. Ascending Triangle:
An ascending triangle features a resistance level and a slope of higher lows. Buyers gradually push the price up, testing the resistance level. This pattern often signals an upward breakout as buyers gain strength and attempt to breach the resistance.
To trade an ascending triangle , set entry orders above the resistance line and below the slope of the higher lows, anticipating a potential upward breakout. However, remain open to movement in either direction, as the resistance level may prove formidable.
3. Descending Triangle:
In contrast to the ascending triangle , a descending triangle comprises lower highs forming the upper line, with a robust support level acting as the lower line. Sellers gain ground against buyers, and in most cases, the support line eventually breaks, leading to a continued downward move.
To trade a descending triangle , set entry orders above the upper line (lower highs) and below the support line, prepared for a potential breakout. Note that sometimes, the support line may hold, resulting in a robust upward move.
4. Broadening Triangle:
Now, let's delve into the captivating Broadening Triangle , also known as a Megaphone Pattern. This pattern stands out due to its expanding price range, creating a distinctive visual pattern on the chart.
The Megaphone Pattern comprises a series of higher highs and lower lows, causing the price range to widen over time. This pattern reflects increasing volatility and uncertainty in the market, with both buyers and sellers actively participating.
Trading Triangles demands meticulous analysis and risk management due to their nature and potential for unpredictable price moves.
To approach Triangle patterns effectively:
1️⃣ Pay attention to the pattern's boundaries: Identify the upper trendline connecting the highs and the lower trendline connecting the lows. These trendlines define the range of price movement within the pattern.
2️⃣ Watch for breakouts and reversals: Triangles often precede significant price movements. Look for breakouts above the upper trendline or breakdowns below the lower trendline as potential trading opportunities.
3️⃣ Confirm with additional indicators: Combine your analysis with other technical indicators or tools to validate your trading decisions. Consider using indicators like moving averages, oscillators, or volume analysis to confirm the pattern's potential direction.
Remember, trading Triangles necessitates careful analysis and risk management. Consider the overall market context, fundamental factors, and other technical signals to make informed trading decisions.
While chart patterns provide valuable insights, they cannot guarantee future price movements. Always conduct thorough research, stay updated with market news, and adapt your strategy as market conditions evolve.
Wishing you successful trading journeys guided by these patterns! 🚀📈✨
💬 We would love to hear your thoughts and feedback on the article! Please leave your comments and questions below the article. Your input is valuable to us!

TRADING SYMMETRICAL⬇️⬆️🔄 ASCENDING📈 DESCENDING📉🔻⬇️TRIANGLES
Hello traders, today we will delve into three types of triangles, which are significant chart patterns providing valuable insights into potential market movements. Understanding these patterns can play a pivotal role in making well-informed trading decisions. Let's explore each type and learn how to identify and interpret them effectively.
**1. Symmetrical Triangle:**
The symmetrical triangle pattern is formed by a series of lower highs and higher lows, resulting in converging trendlines. It indicates a period of market consolidation, where the price oscillates between lower highs and higher lows, signaling an imminent breakout in either direction.
**Key Characteristics:**
- **Shape:** Resembles a triangle, with converging trendlines. The horizontal resistance line connects the price highs, while the rising trendline connects the higher lows.
- **Duration:** Can take several weeks or even months to form, depending on the time frame being analyzed.
- **Volume:** As the symmetrical triangle develops, the trading volume tends to diminish. However, during the breakout, there may be an increase in volume, confirming the validity of the pattern.
- **Breakout:** The pattern is confirmed once the price breaks decisively above the horizontal resistance line (bullish breakout) or below the rising trendline (bearish breakout).
- **Price Target:** To estimate the potential price target after the breakout, measure the height of the triangle at its widest point (the distance between the highest high and lowest low within the triangle) and project it in the direction of the breakout.
- **Stop Loss:** Traders typically place their stop-loss orders just outside the triangle, slightly beyond the opposite trendline from the direction of the breakout, to protect against false breakouts.
Traders often enter a long (buy) position when the price breaks above the horizontal resistance line with a significant increase in volume or below the rising trendline in the case of a bearish breakout.
**Limitations:**
- **False Breakouts:** Sometimes, the price may briefly break above the resistance line or below the rising trendline, only to reverse in the opposite direction, causing a false breakout. Waiting for confirmation is crucial to avoid getting trapped in false signals
- **Market Context:** While the symmetrical triangle indicates potential continuation, it's essential to consider the broader market context and use other technical indicators or fundamental analysis to support trading decisions.
**2. Ascending Triangle:**
The ascending triangle pattern is a bullish chart pattern that forms during an uptrend and represents a continuation pattern. It is formed by a horizontal resistance level and an upward-sloping trendline acting as support. This pattern suggests that buying pressure is gradually intensifying, and a breakout above the horizontal resistance may trigger a bullish move.
**Key Characteristics:**
- **Shape:** Resembles a triangle, where the horizontal resistance line connects two or more price highs, and the rising trendline connects higher lows.
- **Duration:** The pattern can take several weeks or even months to form, depending on the time frame being analyzed.
- **Volume:** Volume tends to diminish as the pattern develops. However, during the breakout, there is often an increase in volume, confirming the pattern's validity.
- **Breakout:** The pattern is confirmed once the price breaks above the horizontal resistance line. The breakout is considered a bullish signal, suggesting that the upward trend is likely to continue.
- **Price Target:** To estimate the potential price target after the breakout, measure the height of the triangle's base (the distance between the horizontal resistance line and the rising trendline) and project it upward from the breakout point.
- **Stop Loss:** Traders typically place their stop-loss orders just below the rising trendline to protect against a false breakout.
**Trading the ascending triangle:**
- **Entry:** Traders often enter a long (buy) position when the price breaks above the horizontal resistance line with a surge in volume.
- **Stop Loss:** The stop-loss level is usually set just below the rising trendline.
- **Take Profit:** The take-profit level is determined using the measured move method by adding the height of the triangle's base to the breakout point.
- **Confirmation:** It is crucial to wait for a clear breakout before entering the trade, as false breakouts can occur. A significant increase in volume during the breakout is often considered a strong confirmation signal.
**Limitations:**
- **False breakouts:** Sometimes, the price may break above the resistance line temporarily and then reverse lower, causing a false breakout. It is essential to wait for a clear confirmation.
- **Market context:** While the ascending triangle is a bullish pattern, it's important to consider the broader market context and analyze other indicators to confirm the likelihood of the pattern leading to a successful trade.
**3. Descending Triangle:**
The descending triangle pattern is a bearish chart pattern that forms during a downtrend and represents a continuation pattern. It is formed by a horizontal support level and a downward-sloping trendline as resistance. This pattern indicates that selling pressure is progressively strengthening, and a breakdown below the horizontal support might lead to a bearish move.
**Key Characteristics:**
- **Shape:** Resembles a triangle, where the horizontal support line connects two or more price lows, and the downward-sloping trendline connects lower highs.
- **Duration:** The pattern can take several weeks or even months to form, depending on the time frame being analyzed.
- **Volume:** Volume tends to diminish as the pattern develops. However, during the breakdown, there is often an increase in volume, confirming the pattern's validity.
- **Breakdown:** The pattern is confirmed once the price breaks below the horizontal support line. The breakdown is considered a bearish signal, suggesting that the downtrend is likely to continue.
- **Price Target:** To estimate the potential price target after the breakdown, measure the height of the triangle's base (the distance between the horizontal support line and the downward-sloping trendline) and project it downward from the breakdown point.
- **Stop Loss:** Traders typically place their stop-loss orders just above the downward-sloping trendline to protect against a false breakdown.
**Trading the descending triangle:**
- **Entry:** Traders often enter a short (sell) position when the price breaks below the horizontal support line with a surge in volume.
- **Stop Loss:** The stop-loss level is usually set just above the downward-sloping trendline.
- **Take Profit:** The take-profit level is determined using the measured move method by subtracting the height of the triangle's base from the breakdown point.
- **Confirmation:** It is crucial to wait for a clear breakdown before entering the trade, as false breakdowns can occur. A significant increase in volume during the breakdown is often considered a strong confirmation signal.
**Limitations:**
- **False breakdowns:** Sometimes, the price may break below the support line temporarily and then reverse higher, causing a false breakdown
. It is essential to wait for a clear confirmation.
- **Market context:** While the descending triangle is a bearish pattern, it's important to consider the broader market context and analyze other indicators to confirm the likelihood of the pattern leading to a successful trade.
**In conclusion, understanding these triangle patterns can provide valuable insights into potential market movements. Traders should use them as part of their technical analysis toolkit and combine them with other forms of analysis to make well-informed trading decisions. Happy trading! 📈💹**
TCPLTP

📈 HOW TO: ASCENDING TRIANGLE PATTERN📍 What Is an Ascending Triangle?
This pattern emerges when the price movement allows for a horizontal line to be drawn across the swing highs, while a rising trendline is drawn along the swing lows. These two lines together form a triangle shape. Traders actively monitor triangle patterns for potential breakouts, which can occur either upward or downward.
Ascending triangles are often referred to as continuation patterns because they typically result in a breakout in the same direction as the prevailing trend that was present before the triangle formation. This pattern offers traders a clear entry point, profit target, and stop-loss level, making it a tradable opportunity. It is worth noting that an ascending triangle can be distinguished from a descending triangle.
📍 How to Identify and Use the Ascending Triangle Candlestick pattern
To identify the ascending triangle pattern, you need to look for a period of price consolidation within an ongoing uptrend. During this phase, the price will exhibit a series of lower highs and higher lows, indicating a temporary balance between buyers and sellers. The upper resistance line of the pattern can be found by connecting at least two highs within the consolidation phase, while a rising trendline is drawn by connecting at least two higher lows.
Confirming the pattern involves ensuring that the price was in a clear uptrend before the consolidation phase, the upper resistance line is horizontal or slightly slanted upward, and the rising trendline intersects with the upper resistance line. Additionally, analyzing candlestick patterns within the consolidation phase, such as doji, hammer, or engulfing patterns, can provide further confirmation of buying pressure.
Once the ascending triangle pattern is confirmed, traders can set their entry and exit points. Typically, a long position is entered when the price breaks above the upper resistance line, indicating a bullish breakout. The height of the triangle pattern can be used to estimate a target price level, and a stop-loss order should be placed below the pattern to manage risk.
💥 Key Takeaways
🔹 Ascending triangles are considered a continuation pattern, as the price will typically break out of the triangle in the price direction prevailing before the triangle, although this won't always occur.
🔹 The trendlines of a triangle need to run along at least two swing highs and two swing lows.
🔹 A long trade is taken if the price breaks above the top of the pattern.
🔹 A short trade is taken if the price breaks below the lower trendline.
🔹 A profit target is calculated by taking the height of the triangle, at its thickest point, and adding or subtracting that to/from the breakout point.
🔹 A stop loss is typically placed just outside the pattern on the opposite side from the breakout.
👤 @QuantVue
📅 Daily Ideas about market update, psychology & indicators
❤️ If you appreciate our work, please like, comment and follow ❤️

📈 4 Common Bullish Patterns🟢 RISING THREE
"Rising three methods" is a bullish continuation candlestick pattern that occurs in an uptrend and whose conclusion sees a resumption of that trend.
This can be contrasted with a falling three method. The first bar of the pattern is a bullish candlestick with a large real body within a well-defined uptrend.
🟢 FALLING WEDGE
The falling wedge pattern occurs when the asset’s price is moving in an overall bullish trend before the price action corrects lower.
Within this pull back, two converging trend lines are drawn. The consolidation part ends when the price action bursts through the upper trend line, or wedge’s resistance.
🟢 BULL PENNANT
A pennant is a type of continuation pattern formed when there is a large movement in a security, known as the flagpole, followed by a consolidation period with converging trend line.
Pennants, which are similar to flags in terms of structure, have converging trend lines during their consolidation period and last from one to three weeks.
🟢 ASCENDING TRIANGLE
An ascending triangle is a chart pattern used in technical analysis. It is created by price moves that allow for a horizontal line
to be drawn along the swing highs and a rising trendline to be drawn along the swing lows. The two lines form a triangle.
Traders often watch for breakouts from triangle patterns. The breakout can occur to the upside or downside
👤 @AlgoBuddy
📅 Daily Ideas about market update, psychology & indicators
❤️ If you appreciate our work , Please like, comment and follow ❤️

Forget about chart patterns! Hello, my dear friends and happy New Year!
I wish you to be healthy and reach all your goals in trading and not only! Never give up on this difficult way which we are going to overcome together!
Today we have a very important topic. How to use Elliott waves instead of classical chart patterns. This is the natural exposure why the chart patterns are garbage. I remember my third year at university when we have the trading lessons. Our teacher gave us a lot of useless knowledges about support, resistance and chart patterns. I have not understood why it should working and it was not soo intereting subject for me. That’s why I returned back to trading much later using self-education. Now I have the clear understanding why Elliott waves is the best tool and why it’s working. Most of traders even don’t understand that chart patterns is just the special case of Elliott waves. That’s why today I decided to explain you how you can change the first one to the second one. Let’s go!
Double Top(Bottom)
On the chart above I drew the different types of double tops. Generally we have 3 types of this pattern
Double top with the second top higher than the first one. In this case we can interpret it in two ways. It could be the classical waves 3, 4, 5 and the corrective wave A at the ending stage. In this case we can anticipate waves B and C. Also it could be the irregular correcton ABC inside wave 4 (rarely in wave 2). In this case we should wait for the wave 5 after that. Traders usually execute short position on the neckline breakdown and suffer when the wave 5 smashed their stop-loss. They are wondering why double top does not working.
Double top with the equal highs has the same possible outcomes. The only one difference that correction called flat instead of irregular.
Double top with the second top lower than the first one. Here is the most common variant is the end of the ABC correction. In this case we have the low potential for shorting the market becuase the new impulsive wave to the upside can hit all stop losses.
Head & Shoulders
This is the easiest pattern for analysis. The right sholder usually is the wave 4, the head, obviously is the wave 5 and the right shoulder is the wave B. On the neckline breakdown we have the shorting potential only in the rest part of the wave C. You could correctly count waves and short that the bearish reversal bar of the wave 5 or, as a last resort, at wave B potential top. Shorting at the neckline has sence only if you are sure that the wave B was the the wave 1 of the impulsive wave to the downside if higher degree and now the market is in wave 3. We have to learn how to count waves in a correct way. I would recommend you to read the Trading Chaos book by Bill Williams because it has the best explanation how do waves work.
Triangles and Wedges
This part is common for all types of triangles (ascending, descending, symmetrical) and wedges (falling and rising). This patterns have the similar structure. If we faced with one of these patterns we have 4 possible scenarios.
Triangle in the downtrend after the wave 3. In this case triangle is the wave 4, which is represented as the triangle correction. This correction type consists of 5 waves A, B, C, D and E. When the wave E is finished market will continue it’s move in the direction of a trend, printing the wave 5.
The same, but in the uptrend.
When the market showed us the 5 waves cycle to the upside and the correction is in progress. Triangle can appears in the wave B. In this case the price will continue the corrective move in the wave C after it’s finished.
The same with the downtrend.
Guys, of course there are much more types of chart patterns. For example, tripple tops and bottoms and so on. The purpose of this article is giving you another view of the market structure and to motivate you studying the Elliott waves theory. Believe me, it has much more potential than it seems on the first glimplse.
Best regards, Ivan
________________________________________________________________________________________________
If you like my educational ideas, please smash the boost button to stimulate me make more quality articles!

How To Trade Ascending Triangle Using A Buy Limit Order (CADJPY)Price closed above horizontal support resistance level. Set Buy Limit Order. Set entry at horizontal level.
Note: Trend is up; Horizontal Level has 4 touches. EMA 10 EMA 20 has a positive slope.

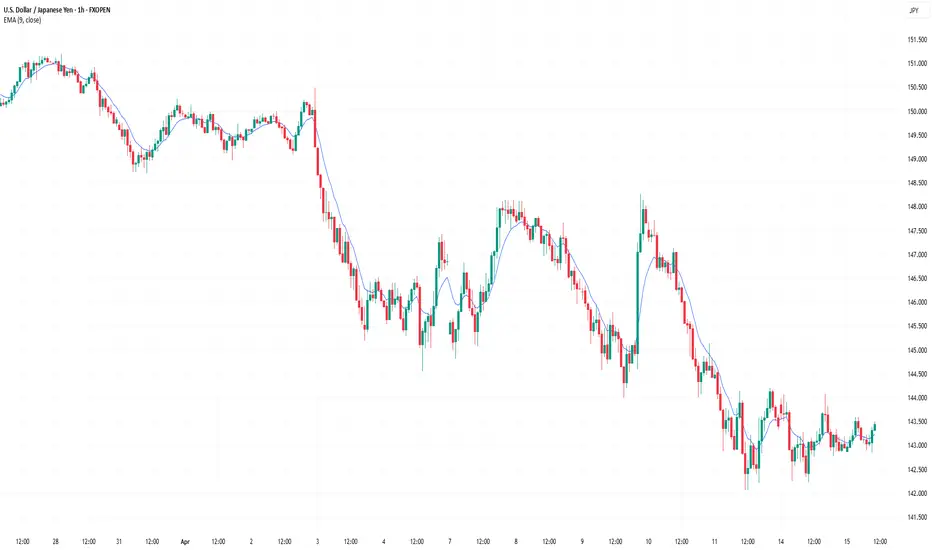
How To Trade Yen Pair With Ascending Triangle (CADJPY)Price closed above 90.334. Now, wait for a price action signal at 90.334.
First price action signal is engulfing candlestick. Enter at 90.505.
Second price action signal is engulfing candlestick. Enter at 90.538. Set Take Profit at 91.185. Set Stop Loss at 90.312. The Reward:Risk Ratio is 2.86.
Note: The EMA 10, EMA 20, and Trend Line have a positive slope. The higher low touches the Horizontal Support, EMA 10 Support, EMA 20 Support, and Trend Line Support.

How To Trade The Ascending TriangleTrade The Ascending Triangle
Engulfing Candle at Diagonal Trend Line Support, EMA 10 Support, and EMA 20 Support. Price Action Signal is Engulfing Candlestick. (First Entry At 128.231)
Pin Bar at Diagonal Trend Line Support, EMA 10 Support, EMA 20 Support and Horizontal Line Support. Price Action Signal is Pin Bar. (Second Entry At 128.310)

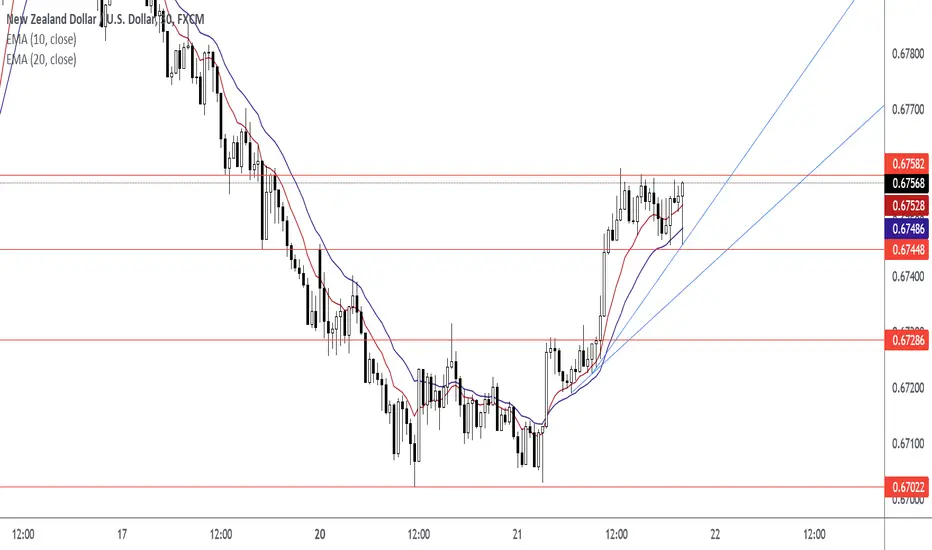
How To Trade The Ascending TriangleThe Breakout (note: the emas are too far away from current price for an entry; watch for a price action signal at the emas; watch for a pull back to the emas)
First Entry At 0.67540
Second Entry At 0.67568
How To Trade The Ascending Triangle Before The BreakoutHow I Trade The Ascending Triangle
Engulfing Candle (Price Action Signal)
First Entry at 0.71194
Candlestick Closed Above Level
Second Entry at 0.71273
Retest Candlestick and Rejection Candlestick at 0.71295
Third Entry
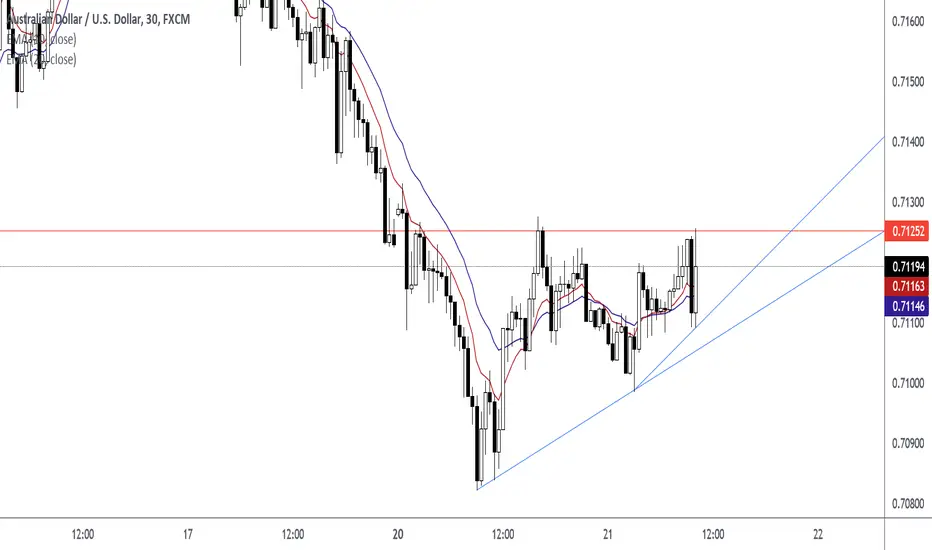
Chart Patterns | Triangles & ChannelsChart Patterns | Triangles & Channels
1- Ascending Triangle :-
An ascending triangle is a type of triangle chart pattern that occurs when there is a resistance level and a slope of higher lows.
2- Descending Triangle :-
In descending triangle chart pattern, there is a string of lower highs that forms the upper line. The lower line is a support level in which the price cannot seem to break.
3- Symmetrical Triangle :-
A symmetrical triangle is a chart formation where the slope of the price’s highs and the slope of the price’s lows converge together to a point where it looks like a triangle.
4- Parallel Channel :-
A Parallel Channel is a chart pattern formed when the price is bounded by parallel support and resistance levels.
5- Ascending Channel :-
An ascending channel is a chart pattern formed from two upward trend lines drawn above and below a price representing resistance and support levels.
6- Descending Channel :-
A descending channel is a chart pattern formed from two downward trendlines drawn above and below a price representing resistance and support levels.
Please like the idea for Support & Subscribe for More ideas like this and share your ideas and charts in Comments Section..!!
Thanks for Your Love & Support..!!

price action patterns you need to know ( part 1 ) Hi friends
i'll share with you some price action
patterns you should know .
I don't like posting a picture with 100 patterns .
I would like to post this in steps so that you can understand more and make things clear .
1- ascending triangle generally happens in an uptrend and is a bullish pattern , you can set your order after the breakout of the horizontal line with a good volume candle .
- descending Triangle Pattern is the exact opposite of the ascending triangle pattern. It is a bearish continuation pattern indicating that the prior downtrend will continue and you set your order after the brakout of horizontal line with a good volume candle .
please support me with like and follow me for more ideas and tell me what do you think about that

What is Ascending Triangle Pattern?What is an Ascending Triangle Pattern?
Ascending Triangle Pattern is a continuation pattern that means when it plays out it will continue the preceding trend. It is created by price moves that allow for an upper horizontal line to be drawn along the swing highs, and a lower rising trendline to be drawn along the swing lows. These two lines form an ascending triangle. Traders here usually watch for breakouts from upper resistance in ascending triangle patterns.
How does the Ascending Triangle Pattern work?
After the prior uptrend when investors try to book profits it creates a resistance that leads to a high supply zone. But due to the prior uptrend investors are still interested in the asset which leads to picking up in demand slowly, resulting in a rising trendline. Time in this phase is also a crucial element. The longer this pattern consolidates, the more chances it has to give a possible breakout to continue the uptrend.
Why is the Ascending Triangle Pattern Unique?
Ascending triangle patterns usually have a higher breakout success rate than symmetrical triangle patterns. In an ascending triangle, higher lows are constantly being built, which shows there is a strong demand for the asset.
Role of Volume:
Volume plays a major role in the completion of all major patterns. The horizontal trendline which acts as resistance can give spikes in volume. We will call it a breakout when a candle closes above horizontal resistance level with a great volume spike or rise in average volume.
Above Chart Explanation:
This is the 4H chart of FTTUSDT with a clear preceding upward trend. After the uptrend, we enter the second phase where the upper horizontal line becomes resistance 4 times in a row and the lower rising trendline becomes support 3 times in a row. As we have observed here FTTUSDT consolidated for nearly 1 month in an ascending triangle pattern, which finally led to a super bullish breakout.
Two Possible Entries:
Entry 1: On rising support, when the price touches the rising support trendline and if there is rising average volume, it makes a good entry with a stop loss placed below the previous higher low point.
Entry 2: On resistance breakout, we should wait for the 4H candle to close above the resistance to confirm the breakout’s validity. Once the breakout is valid, a potential opportunity would be to enter at the close of the 4H candle with a stop loss placed a little below the breakout level. Usually, we should target the height of the triangle after the breakout.
Comment down your thoughts on Ascending Triangle Pattern in the comment section.
Disclaimer:
This is just an educational post. Never trade just any pattern. And please do your research before making any trades.
Happy Trading!

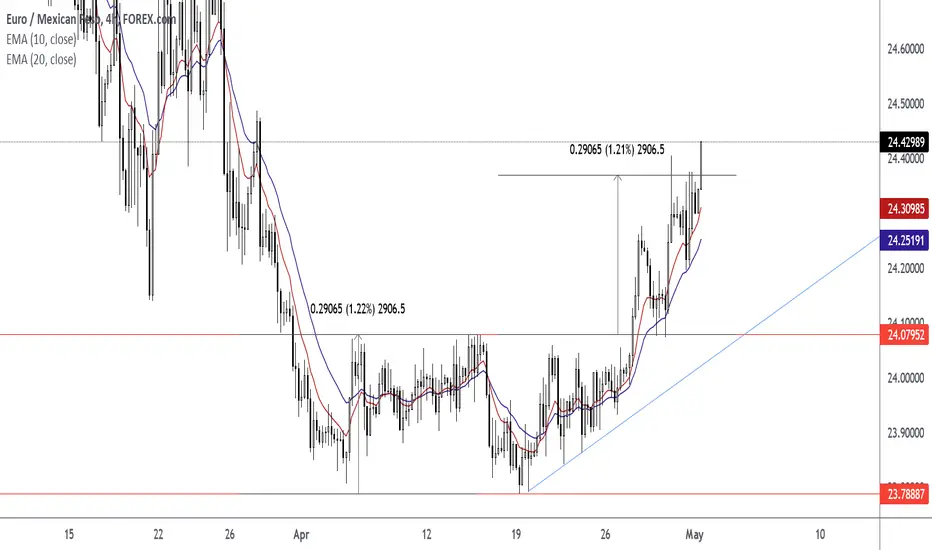
How To Trade The Ascending Triangle + Double Bottom ComboWait For The Close Above the Neckline at Horizontal Level 24.07952. After the close above level; resistance level turned support.
Wait For The Retest Of The Neckline At 24.07952. Watch For A Pin Bar or Rejection Candlestick to form at the horizontal neckline.
Enter Trade At The Closing Price Of Pin Bar or Rejection Candlestick.
Set Target Price Using Measured Objective Of Pattern. Measured Objective Is 24.37017. Measured Move Is 2906.5. Height Is 2906.5.
Exit Trade At Target Price.
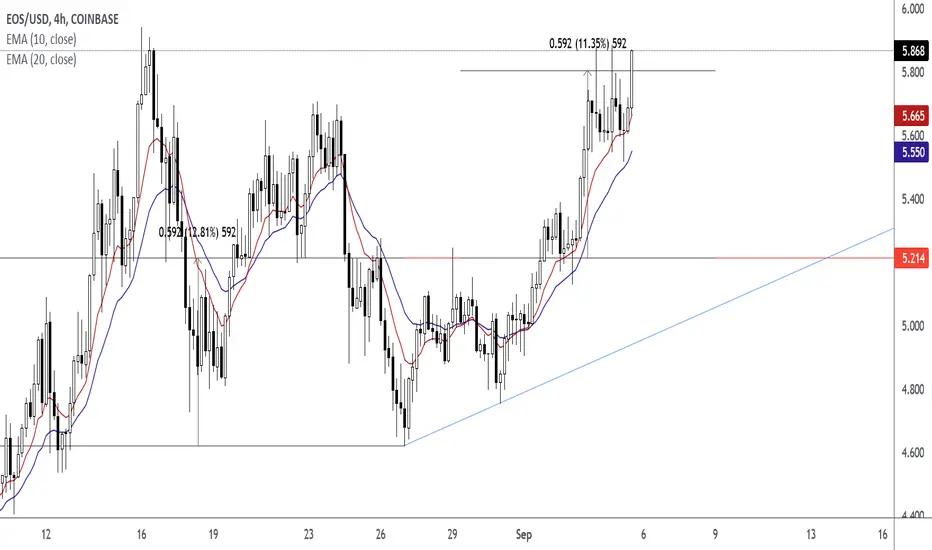
How To Trade The Ascending Triangle Trading The Ascending Triangle
Wait For The Close Above The Horizontal Level
Wait For The Retest in the form of a pin bar or rejection candlestick.
Enter At The Close Price of Pin Bar or Rejection Candlestick
Exit At The Measured Objective of Pattern. The Height of Pattern is 592.
📚Trading Lesson. Triangle Types & How to Read Them📚
Triangle is a classic price action pattern that is applied by technical analysts to make predictions trading different financial markets.
Depending on the shape of the triangle, there are three main variations of this pattern.
Its meaning changes dramatically from one to another so it is crucially important for you to know the difference.
👉 The symmetrical triangle is determined by two contracting trend lines.
The pattern is considered to be indecisive meaning that while the market is stuck within, the directional bias is unknown.
Only the breakout of a boundary of a triangle clarifies the future direction.
👉 In contrast, the ascending triangle (also called a bullish accumulation) is a classic example of a bullish biased pattern.
With a horizontal trend line serving as resistance and a rising trend line service as support, the market is accumulating volumes for a bullish breakout.
Once the horizontal resistance is broken, bullish continuation follows.
👉 The descending triangle is a bearish biased pattern. Also called a bearish accumulation, the pattern indicates the preparation of the market participants to set a new low after consolidation and contraction within a triangle.
Once the horizontal support is broken, bearish continuation follows.
🔔Please, support this educational post with a lovely comment and like.
Also, subscribe to our page for more educational posts & signals.🔔
