Ascending Triangle - What's the phycological Truth behind this?We see many trend patterns while trading. One of them is ascending Triangle.You guys may rote that ascending Triangle is always bullish and it will be always bullish. But why it is bullish? Can't it be bearish any time? If not, Why? If yes, when? If you are finding the answers of these questions,this article is for you. Don't escape any line. Please read the full article. You will find your answers and will enjoy this article. Now Let's get into the topic✅✅
1️⃣ You may know Uptrend is always bullish and Downtrend is always bearish. What's uptrend or Down trend? An uptrend is when candlesticks make HH and HL or same High and higher Low. In an ascending Triangle, Candlesticks make same High and Higher Low. So it makes an uptrend into ascending Triangle. As a result it is bullish structure.
2️⃣ You may hear this " The more times candlesticks touches the trend line the weaker it becomes." In aline cending Triangle candlesticks touch the resistance 3 times but touch the support 2 times. As a result the resistance become weaker and get broken.
3️⃣ So a ascending Triangle never becomes bearish? Obviously it does. When the trend touches support line 3 times,it becomes an Head and Shoulder pattern. And it becomes bearish and breaks the support line.
4️⃣ Another bearish form of ascending Triangle is when trend makes a double top pattern into ascending Triangle.
✳️✳️ Now where to take entries?
Long position After the retest of previous resistance as support and short position after the retest of previous support as resistance.
✳️✳️Where to put SL? That's you all know where to put SL. You can put SL according to your bookish knowledge. But I prefer smart SL. I will share How to put smart SL in future.
✳️✳️Now I want your opinion. How's the article? Is it good or bad? I want to know your opinion eagerly. Please comment your opinion below. And A like is always appreciated. Thanks❤️
Ascending Triangle

👨🏫 Continuing Pattern: ✅ Triangles👀Triangles are among the most reliabiable of the continuation pateerns. There are 3 types of Triangles with forcasting value.
Ascending Triangles
Descendung Triangles
Symmentrical Triangle

EDUCATION: Ascending TriangleHello, dear subscribers!
Today we will talk about the most popular chart pattern - the ascending triangle. This is commonly known bullish pattern and its correct recognition will help you to earn money.
How to identify the Ascending Triangle?
First of all we should clearly understand that the price now is in global uptrend. The socond one is the uptrend support line. There are should be at least three attempts to break this line down. The last component of the ascending tringle formation is the horizontal resistance line.
How to trade with the ascending triangle?
If the ascending triangle pattern is formed you should identify the breakout point. It is the most difficult part of the analysis because the ideal triangle pattern is rare. We have to find some confirmation of the uptrend continuation with another indicators.
The last question is how to set the take profit. It is usually used the triangle height for the take profit setup.

💡Ascending Triangle in ZECUSD - "Learn More Earn More" With USAscending Triangle Definition:
An ascending triangle is a type of triangle chart pattern that occurs
when there is a resistance level and a slope of higher lows .
It is defined by two lines:
. A horizontal resistance line running through peaks.
. An uptrend line drawn through the bottoms.
The higher lows indicate more buyers are gradually entering the market
and buying pressure increases as price consolidates moving further towards the apex.
An ascending triangle is classified as a continuation chart pattern .
If price can break through the resistance level, that level will now act as a support level.
Breakouts can also happen in both directions. Statistically,
upward breakouts are more likely to occur, but downward ones seem to be more reliable.
In most cases, the buyers will win this battle and the price will break out past the resistance.
But Sometimes the resistance level is too strong,
and there is simply not enough buying power to push it through.
Therefore you should be ready for movement in EITHER direction.
ENTRY:
We would set an entry order above the resistance line and below the slope of the higher lows .
TARGET:
Target is approximately the same distance as the height of the triangle formation.
❤️ If you find this helpful and want more FREE forecasts in TradingView
. . . . . Please show your support back,
. . . . . . . . Hit the 👍 LIKE button,
. . . . . . . . . . Drop some feedback below in the comment!
❤️ Your Support is very much 🙏 appreciated! ❤️
💎 Want us to help you become a better Forex trader ?
Now, It's your turn !
Be sure to leave a comment let us know how you see this opportunity and forecast.
Trade well, ❤️
ForecastCity English Support Team ❤️

Psychology and description of the ascending triangleHi every one
Kindly like the ideas if it is helping you and leave a comment
Triangle patterns are some of the most commonly used chart patterns within the world of trading. The vertex of a triangle pattern represents a pivotal point during an ongoing battle between the bulls and the bears, thus making it an attractive setup for traders. The three most common triangle patterns include symmetric, descending, and ascending. Today, me will discuss the ascending triangle pattern.
what is ascending triangle:
An ascending triangle pattern is comprised of two key elements:
1. Bottom Trend Line (Support) – An ascending triangle is characterized by a bottom trend line that is formed as the stock continues to set higher lows. The more touch points on the trend line, the more reliable it will be.
2. Flat Resistance Line – An ascending triangle also contains a flat horizontal resistance line that is formed as the stock continues to reject its previous highs (for a given period). Once again, the more touch points on the resistance line, the more reliable the pattern will be.
Characteristics of an Ascending Triangle Pattern:
Bullish Pattern – An ascending triangle is considered to be bullish, meaning traders will be looking to initiate a long position upon a break of the upper resistance level.
Continuation Pattern – An ascending triangle is generally a continuation pattern, meaning that it’s predictive nature is most effective when a stock is continuing an uptrend.
Time frame – Ascending triangles can be used on multiple timeframes. They may exist on intraday charts, hourly charts, daily charts, and weekly
charts.
Psychology Behind the Ascending Triangle Pattern:
It can be helpful to think of the ascending triangle pattern as a visualization of an ongoing battle between the bulls and the bears. The bulls keep pushing the stock up in price until they get overpowered by the bears (at the flat resistance level). The bears attempt to push the stock down, however the bulls are persistent and the stock sets a higher low (bottom trend line).
This pattern continues until the price action becomes confined to the vertex of the triangle, representing a pivotal moment in this battle. At this point, either the bears will win and the stock will break the bottom trend line, or the bulls will win and break the flat resistance line. Historically speaking, this pattern favors the bulls, and if the flat resistance line is broken, the bulls will be able to push the price up, triggering a breakout.
How to Trade the Ascending Triangle:
It’s important to keep in mind that even though this is a bullish pattern, a breakout is not guaranteed. Chart patterns should be used as tools, not definitive solutions for conquering the market. Therefore, you should still apply your other trading rules and strategies when utilizing chart patterns.
Here are a few guides for placing a trade based on the ascending triangle pattern.
Wait for the Breakout – Unless you’re experienced in trading ascending triangle patterns, you should wait the stock to break above the flat resistance line before placing a trade. You may get a better price if you buy shares earlier, but you are also exposing yourself to additional risk. Be patient and set an alert in your trading software if you’d like.
Look for Volume – High volume in the stock market represents conviction behind a move, indicating that a large amount of traders want a position in the stock. While above average volume is not necessary for an ascending triangle pattern breakout, it may increase the likelihood of a stronger move.
Look for Confirmation – If an ascending triangle breakout is genuine, the flat line resistance level should become a support level. If the stock starts to pullback after the breakout, you should look for the previous resistance level to hold as support. This will help confirm the legitimacy of the breakout. It also allows traders who missed the initial move to take a position.
Have an Exit Plan – All trades require an exit plan for both favorable and unfavorable outcomes. If the stock pulls back and breaks the support level (previous flat line resistance), you may consider exiting your position, as the legitimacy of the breakout is in question. You will also want to have a plan for when to take profit if the stock moves in your favor.
Traders, if you liked this idea or have your opinion on it, write in the comments. I will be glad
Thank you for seeing idea . please support us
Good luck.

How To Trade an Ascending Triangle - Educational PostHOW TO TRADE THE ASCENDING TRIANGLE?
1. Wait for the price to breakout from the inside of the triangle.
2. Enter the trade when price retest the breakout level.
3. Set your Stop-Loss below the last Lower Low of the market structure.
4. Set target to be equal with the distance from A to B.
This tutorial contains educational material.
Please hit the LIKE button to support me!
FOLLOW ME if you liked this post and want to see more educational post and trading ideas.
Thank you!

Psychology behind Ascending and Descending Triangles PatternJust as with ascending triangles, most of the times, the price will break the horizontal support line, and continue with the move lower.
there is usually psychology behind every chart pattern ; and ascending and descending triangles are no exception.
Follow me closely as we will now ‘investigate’ the PSYCHOLOGY behind ascending triangles :
To make the analysis easier, let’s think of the ascending triangle pattern as a visualization of an ongoing battle between the bulls (#buyers) and the bears (#sellers).
The bulls keep pushing the stock up in price until they get overpowered by the bears/sellers at the horizontal resistance level.
It is at that resistance level that bears/sellers attempt to push the price down.
Though sellers are somehow successful in pushing the price down, they are however unable to push the price to the previous low levels, as bulls/buyers are persistent, and the price sets a higher low (bottom trend line).
This pattern continues until the price action becomes confined to the vertex of the triangle, representing a pivotal moment in this battle. At this point, either the bears will win, and the stock will break the bottom trend line, or the bulls will win and break the horizontal resistance line.
If history is anything to go by, this pattern favors the bulls, and if the horizontal resistance line is broken, the bulls will be able to push the price up, triggering a breakout.
This same psychology also applies to descending triangles, but in reverse .
Now let’s looks at how we can to make money from this chart pattern:
1. Wait for the Breakout –we should wait price to break above the horizontal resistance line before placing a trade.
2. Lookout for Volume – High volume usually represents conviction behind a move, indicating that a large number of traders want a position in the stock. While above average volume is not necessary for an ascending triangle pattern breakout, it may increase the likelihood of a stronger move.
3. Look for Confirmation – If an ascending triangle breakout is genuine, the flat line resistance level should become a support level. If the stock starts to pullback after the breakout, you should look for the previous resistance level to hold as support. This will help confirm the legitimacy of the breakout. It also allows traders who missed the initial move to take a position
4. Have an Exit Plan – All trades require an exit plan for both favorable and unfavorable outcomes.
For ascending triangles, Stop loss should typically be placed just below the previous horizontal resistance (which will now be acting as support).
Thanks for Your Likes & Support & Subscribe....

THE ASCENDING AND DESCENDING TRIANGLE CHART PATTERN
Ascending triangles are classified as continuation Patterns . Here are the key elements that make up an ascending triangle:
1. Bottom Trend Line(Support) – An ascending triangle is characterized by a bottom trend line that is formed as the price continues to set higher lows. The more touch points on the trend line, the more reliable it will be.
2. Horizontal Resistance Line – An ascending triangle also contains a flat horizontal resistance line that is formed as the stock continues to reject its previous highs (for a given period). Once again, the more touch points on the resistance line, the more reliable the pattern will be.
You must be wondering how the chart pattern get to be formed?
What happens during the formation of an ascending triangle is that there is a certain level that the buyers cannot seem to break ( red resistance line ).
However, as evidenced by the higher lows ( green uptrend support line ), buyers will gradually push the price up, hence we end up with an uptrend of higher lows.
As buyers and sellers keep putting pressure, a breakout will become inevitable.
Though a price breakout is inevitable, the big question is, “ Who will break the price, buyers or sellers? Will the buyers be able to break that resistance level, or will the resistance be too strong?”
Well, the answer is, most of the times the price will break the resistance area and go up.
However, it is not always the case, sometimes, the resistance is too strong for buyers to break.
Now let’s look at its inverse, the DESCENDING TRIANGLE CHAT PATTERN
In a descending triangle chart pattern, as can be seen on the BTCUSD chart above, there is a string of lower highs which forms the upper line (red resistance line). The lower line is a support area (green horizontal line) in which the price seems to be failing to break.
Just as with ascending triangles, most of the times, the price will break the horizontal support line, and continue with the move lower.
Follow me closely as we will now ‘investigate’ the PSYCHOLOGY behind ascending triangles:
To make the analysis easier, let’s think of the ascending triangle pattern as a visualization of an ongoing battle between the bulls (buyers) and the bears (sellers).
The bulls keep pushing the stock up in price until they get overpowered by the bears/sellers at the horizontal resistance level.
It is at that resistance level that bears/sellers attempt to push the price down.
Though sellers are somehow successful in pushing the price down, they are however unable to push the price to the previous low levels, as bulls/buyers are persistent, and the price sets a higher low (bottom trend line).
This pattern continues until the price action becomes confined to the vertex of the triangle, representing a pivotal moment in this battle. At this point, either the bears will win, and the BTC will break the bottom trend line, or the bulls will win and break the horizontal resistance line.
If history is anything to go by, this pattern favors the bulls, and if the horizontal resistance line is broken, the bulls will be able to push the price up, triggering a breakout.
Thanks for Your Likes & Support & Subscribe....

XAUUSD Triangular Correction - Is it Ascending or Symmetrical?The market isn't giving anything away as usual... what do you think this triangular correction is?
Please leave a comment!
*Disclaimer*
This is not trading advice. All content/ information shared in this idea is purely educational in nature and is expected to be used for analysis and illustration purposes only.
Do not trade or speculate based solely on the information provided.
Trust you own analysis.
Beyond Edge

Be Careful to Hedge Your Longs: Bearish Ascending Triangle!We could see of a continuation of the Coronavirus market crash and see a new YTD low if we see more red candles.
#wedge

JPXJPY : LEARN ELLIOTE WAVE ELLIOTE WAVE LEARNING CORRECTIVE OR IMPULSIVE WAVE
CORRECTIVE WAVE RETRACE 50% FIB LEVEL FROM IMPULSIVE WAVE
#WAVE 4 NEVER ENTER IN TERRITORY OF WAVE 1
#WAVE 3 NEVER BE SHORTEST WAVE
For more learning about Elliote wave please like share and comment if any question

Ascending Triangle as Continuation and Bilateral patternAscending Triangle Pattern Tutorial :
Ascending Triangle is a Bullish Pattern and sometimes also act as Bilateral Pattern;
What is Bilateral Pattern : Bilateral Chart Patterns are triangular patterns; they signal either a continuarion or reversal of the current price movement, mainly it depends on how the price breaks the triangle pattern. There are three main types of Bilateral Chart Patterns;
1) Ascending Triangle, 2) Descending Triangle, 3) Symmetrical Triangle.
An Ascending Triangle can be easily identified if you see a rising lower trendline along with a flat resistance. Also ascending triangle have some shortcomings like it can occur false breakout and the price reverses. You need to see how strong the breakout was by looking at volume at the time of breakout and if the breakout is not strong enough you can exit the trade and before entering you need to manage risk accordingly.
Check Out other tutorials; (), ()
Stay Tuned 👍;

S&P 500 Emini Futures 1D Trend Following StrategyEmini Trend Following Strategies
The Emini trend following strategy is probably the most powerful. Trend following has the potential to generate the biggest profits. One of the greatest traders of all time Jesse Livermore said that the big money is always made on the big market swings.
We have identified two parameters that can be used to determine when we’re going to have a strong trading day:
Strong trend trading days come after small daily range bars.
Both the closing and the opening Emini prices close near the high and the low of the day.
These Emini price characteristics need to be used in conjunction with other technical tools. It is a simple Emini pattern that can be used to develop a trading strategy around it.
Why Trade Emini Futures?
The main reason to trade the Emini strategy is to have a diversified exposure to the US stock market. While Emini futures are more suitable for day trading they offer several advantages for swing traders as well.
Other reasons to trade the ES contract are:
You can go both long and short. Unlike stock trading, there is no uptick rule when shorting the Emini contract.
Trading around the clock 24-hours per day. This is extremely attractive as you can trade Emini futures around the world. You can also take advantage of the overnight Emini price swings.
Tight bid/ask spreads. The large traded volume through the Emini contract offers cheap costs to enter and exit a trade.
The SPX is traded on a centralized exchange (the CME), which often can translate into much clear technical chart pattern that is unique.
As you can see the Emini futures market is very tempting as there are numerous trading opportunities. However, trading the Emini market without losing your hard-earned capital is a little bit harder. That’s why in order to increase your chances of successfully day trading Emini, we’re going to share the best Emini trading strategy.
With this approach, you can build another stream of income.
The only way you make money in the market is if you’re able to catch a trend. It doesn’t matter if you’re a day trader or a swing trader. In order to make a profit day trading the 5-minute time frame, you need an intraday trend to secure a profit.
The best Emini trading strategy requires to hold your trades to the close. Don’t try to get in and out scalping ES futures because when you have a loss most likely it will eat all the previous profits. Instead, try to catch a trend move and hold it to the close.
With this approach, you’ll make a lot more money because during the trend days the Emini contract tends to close near the high for bullish candles. The same is true for all large bearish range day, which closes near the low of the candle.
Go study your Emini chart and you’ll see this repeating pattern over and over again. Some research suggests that when the Emini futures close in the top 10% of its range, it has an 80% chance of follow-through the next day
Trade your trading plan to find entry, Stop Loss & Take Profit.

ETHUSD 1D LONG or 1H BEARISH CONTINUATION1D ASCENDING TRIANGLE BULLISH BREAKOUT.
Wait for a Daily Candle Close above triangle.
1H PULLBACK TRENDLINE BEARISH CONTINUATION BREAKOUT.
Wait for a 1H Candle Close below Pullback Trend line.
Or wait for a Bearish Continuation Break-Hook-Go candle pattern.

S&P 500 ETF 1D ASCENDING TRIANGLE LONG BREAKOUTAscending Triangle
An ascending triangle consists of a strong resistance level.
Strong levels are usually pretty obvious.
There will be lots of wicks and bodies that touch a horizontal trendline.
A trendline is not just a line but it is always a zone.
So you can expect the price to push through the level sometimes.
Other times price will just approach the level.
Draw the line with the intent of finding the price where the activity seems to be most prominent.
Draw it so there are no candle bodies above the line so the line can be used as a trigger price.
A close above the line will be a trade trigger.
Just like all ines this line is very subjective.
You won't get it exactly right every single time.
You can adjust this line if a head fake happens and price falls back inside the triangle.
A far less important line but an important indicator of what is happening in this marketis the ascending portion of the triangle.
This shows us that fewer and fewer traders are willing to see the price drop lower.
Everytime the price is pushed down it gets pushed back up more quickly.
Price gets trapped between these two lines and the pressure to break the resistance level gets stronger and stronger until it finallys breaks.
If price pushes below this uptrend line then redraw it as long as the price goes back into the triangle.
Watch that the volume continues to decline also.
Watch that a triangle will break usually when price reaches 2/3 to ¾ of completion.
Price could break sooner.
As a confirmation of the consolidation pattern watch for a decline in volume and ATR/volatility.
This represents boredom on the part of traders.
Fewer traders are willing to participate in the consolidation and are sitting around waiting for it to break.
Use the built-in Trading View volume indicator.
Click on indicators- select built-ins – scroll down until you see volume – click on it.
The volume will appear in the same window pain as the price action.
To seperate it from the price action right-click on the indicator- select “move to” to “ new pane below”.
This will seperate the volume frpom the price action pain.
Select the default volume MA of 20 periods.
Use the volume indicator with a moving average because we need to know what the average volume is. Right click indicator – select style – click volume MA.
20 periods is roughly 4 weeks of data for most markets.
Volatility is trader speak for how much the price is moving around.
For volatility use the average true range (atr) which is the average of the lengths of the last number of candles.
Use the default of 14 periods for the Trading View indicator.
This is a short er time period for the ATR so to bet a little quicker idea of what the volatilityis doing.
14 periods represent roughly 3 weeks of data for most markets.
There are always anomalies, news events and a data release that is messing with these patterns.
A brief hiccup in a pattern does not necessarily negate the pattern if the price falls back into the pattern after these events.
Trade the ascending triangle only with a bullish breakout of the resistance level.
Enter a buy trade on a breakout candle close of the resistance level on your timeframe.
Our upper triangle trendline has no candle closes above it os a close above that level is significant.
What if it is a false breakout or head fake?
Look for volume on the breakout and just go with it. If there is a cnadle close back inside the consolidation triangle then close the trade for a loss and move on the keep the loss small.
How to move on depends on what the chart does for the next few bars.
If price settles back into the original triangle with the exception of the head-fake and the volume & ATR/volatility continue to decline, then redraw the resistance level to above the candle bodies on the head fake and look for another breakout.
Otherwise just call it a blown pattern and look for other opportunities.
Everything also applies to a descending triangle.
Just look for a strong support level and for the break to the downside.

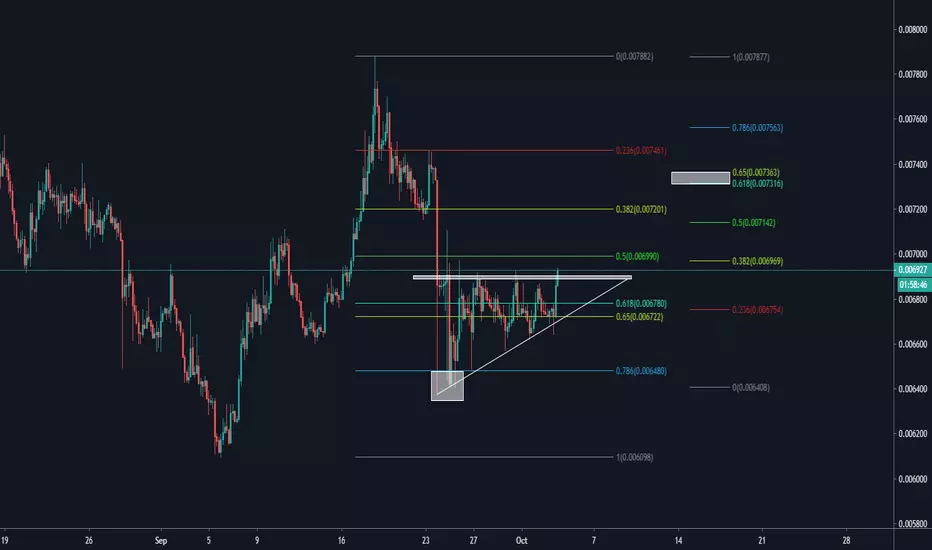
Litecoin bullish patternHey Fellas, feel so interesting with last few days trading result which gives me personally a good gains on some of my coins that I hold. The most profitable coins that I am holding is PPT on Binance and of course for you who have followed my channel, you will realize it as well.
And litecoin here is one of many candidates that I would like to share to you. The first indication that I was very interested is the price bounced as soon as it touched the 78.6 fibonacci retracement area which we know it as a significant levels for some instruments in the last 2 or 3 years. The second indication that I believe you will agree with me and it's very hard to argue in my opinion is the price has formed an ascending type of the triangle which usually end up bullish. Broken out of the horizontal resistance zone will be my entry point for long/buy position.
My nearest target absolutely at the golden pocket zone and then we can target the previous swing high as well.
FTSEMIB, FTSE MIB Index - Potential Breakout on ParabolaINDEX:FTSEMIB
The parabolic support guides us on a possible breakage of this resistance on the Italian index would make very interesting from the point of view of Risk Reward this potential trade since from that level onwards would meet much less resistance giving confidence to buyers to ride a possible trend.
Set alerts!
Stay Tuned!

Ascending Triangle Confirms Price Spike Ascending triangle paired with descending volume during consolidation pointed to a price spike in Bitcoin earlier today.
Top may be in or at $10,200
Further lows most likely await.

1 HOUR TO OUR LIVE TRIANGLE TRAINING CLASS - TODAY AT 2PM ET!COME JOIN US FOR A GREAT OPPORTUNITY TO LEARN TOGETHER
We are doing a live triangle trading class on our TTT Strategy TODAY! @ 2PM ET! If you are interested in learning more about it, please visit the link you see below in our signature. Thanks!

2 HOURS TO OUR LIVE TRIANGLE TRAINING CLASS - TODAY AT 2PM ET!ADD A WHOLE NEW QUIVER OF ARROWS TO YOUR TRADING STRATEGIES
We are doing a live triangle trading class on our TTT Strategy TODAY! @ 2PM ET! If you are interested in learning more about it, please visit the link you see below in our signature. Thanks!

3 HOURS TO OUR LIVE TRIANGLE TRAINING CLASS - TODAY AT 2PM ET!LEARN THE MOST LUCRATIVE TRADING STRATEGY IN THE MARKETS
We are doing a live triangle trading class on our TTT Strategy TODAY! @ 2PM ET! If you are interested in learning more about it, please visit the link you see below in our signature. Thanks!

4 HOURS TO OUR LIVE TRIANGLE TRAINING CLASS - TODAY AT 2PM ET!LEARN A UNIQUE STRATEGY OF TRADING THE MOST COMMON CHART PATTERN IN THE MARKETS
We are doing a live triangle trading class on our TTT Strategy TODAY! @ 2PM ET! If you are interested in learning more about it, please visit the link you see below in our signature. Thanks!

5 HOURS TO OUR LIVE TRIANGLE TRAINING CLASS - TODAY AT 2PM ETALL MARKETS - ALL TIME FRAMES - ALL STYLES OF TRADING
We are doing a live triangle trading class on our TTT Strategy TODAY @ 2PM ET! If you are interested in learning more about it, please visit the link you see below in our signature. Thanks!
