No Longer Random: Here's Why I Believe in Fib Ratios & HarmonicsI am going through a book on Harmonics and Fibonacci ratios (The Harmonic Trader by Scott Carney), and I'm seeing for myself how these ratios can be used as key areas of reversal.
I used to believe that day-to-day price action was random, but after looking at several charts for myself, I now reject my old belief and concede that price action is greatly tied to key Fibonacci levels and conforms decently to harmonic patterns.
The key levels I highlight here are
- 0.382
- 1.618
In the first leg, we draw our Fib off of the pivot around the $51 level to the pivot high around the $70 level. Here, we can see a reversal off the 0.382 level almost 100% cleanly.
In the second leg, we draw our Fib off that same pivot high around the $70 level to the pivot low around the $63 level. Here, we see a reversal off of the 1.618 extension level, another key reversal level.
In the third leg, we draw our Fib off that same pivot low around the $63 level to the pivot high around the $76 level. Here, we see a test of the 0.382 level, again.
But wait, there's more.
We can also draw an AB=CD harmonic using the following levels.
- A: Pivot low around $56
- B: Pivot high around $70
- C: Pivot low around $63
- D: Pivot high around $76
The AB leg is roughly the same length as the CD leg.
As you can see, AB=CD reversal also happens to be in that same 1.618 area.
All of this works together in unison.
Amidst all of these reversals off these levels, here's my Golden Rule : Use market structure as confirmation of these reversals. Look for 'M's (double tops) and 'W's (double bottoms), as well as bullish/bearish candles when appropriate, to confirm the direction of the reversal. Don't blindly trade solely off of levels.
I didn't cover them here, but I also love seeing reversals off of 0.618 and/or 0.786 levels. Those occur very frequently, too. Just gotta train your eyes.
AB=CD

Possible AB=CD & iHnSAm aware iv put a lot of information on the chart thats why i placed it as educational. You may as well post your view.
Now iv been holding this pair for quite some time now, to the previously posted setup. Placing an eagles eye on it and these are the possibilities that i foresaw.
The pair is currently retracing and if it holds down there it would bring out an AB=CD pattern to complete my previously posted setup. Having NZD strong and Yen weak, i am hoping for a breakout. an iHnS should take precedence as it pulls back for a test. Completing the pattern should also align it well with a possible Flag to help our trend to continue on bullish.

GOLD - Daily - Multi-Timeframe Analysis Series 1GOLD has a correlation to the strength of USD, as a risk-off asset investors seek haven in the event of Dollar weakness (USD falls > GOLD rises). I'm sure there's more to it than that, be sure to check it out online for yourself.
Comments
The Daily timeframe is looking very clean when it comes to price action.
Having formed bearish MACD Divergence between 4th January - 20th Feb, we have since seen this break down on the the lower timeframes. What concerns me about shorting this just now though is the Daily 50 EMA which seems to be propping up price at the region of 1300. This is the same region we had a minor rejection on the Weekly timeframe too.
The two red arrows highlight the potential for 2 shoulders, one left and one right, which could be an indication of a bearish Head & Shoulders pattern forming. This adds a lot of confluence to our overall bearish sentiment, and could be the markings of further consolidation which we referred to in the earlier lessons.
A double top on the Daily would be a prime signal for a sell-off cascading up the higher timeframes. This may not happen if we see more selling pressure. Let's see what this next week brings!
Key Note
Head & Shoulders patters can be traded as is or used for overall market sentiment. In their nature, they are consolidation / reversal formations.


how to identify abcd pattern
hey traders,
this Monday I want to share with you my thoughts about dollar yen currency pair.
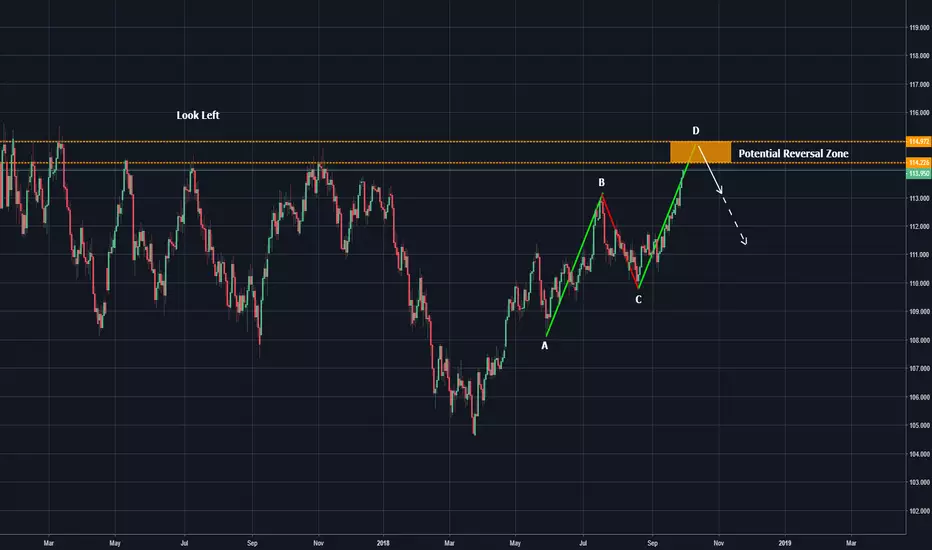
As the market has been violated 113 structure level, I anticipate bullish continuation up until
at least 114 level.
As the market reaches 114 I will be looking for counter trend opportunities.
One of them is this potential bearish abcd pattern.
It is an easily identifiable pattern. Basically, three steps are required:
1) identify impulse leg (in our case it is a steady movement from 108 to 113)
2) identify retracement (113 to 110)
3) projection of impulse leg from C point(110 - the end of retracement)
looking left, and identifying major levels of structure I underlined potential reversal zone where
the market is most likely to reverse.
When the market will reach this zone I will be looking for some confirmation.
Targets are based on structure.
Good luck!
XAUUSD - ABCD PatternHow to trade the ABCD pattern
This is an example of a bullish ABCD pattern.
Ideally, Point C should be Fibonacci retracement between 61.8% to 78.6% of the A-B leg.
Point D should be a Fibonacci extension between 127% to 161.8% of the B-C leg.
Stop loss should be below D or previous low.
Take profit can be at the 38.2% and 61.8% Fibonacci retracement of the C-D leg.

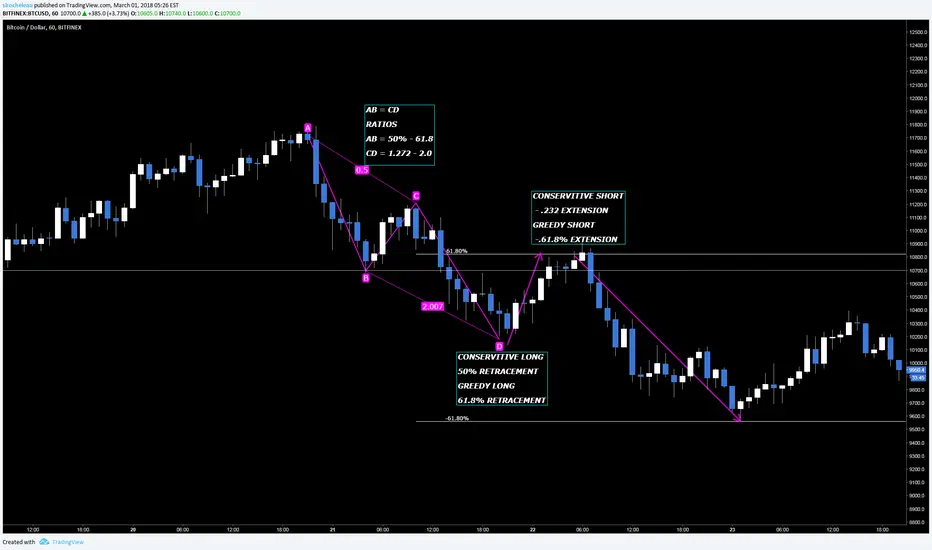
HOW TO TRADE THE AB= CD PATTERN.
PART 1 AB =CD ( The Retrace )
You will find Harmonic patterns everywhere.. All you have to do is look..
Once you've established an AB=CD Pattern is close to being complete or has been completed it's game time.
In a down trend you will find Bullish AB = CD patterns. That's bc the market has moved down, over extended it'self momentarily and is ready for a retracement / correction. (does not mean trend is dead Which is where you make your second jack pot of the trade.)
I like to set realistic Targets or TPs which is why on my trades you will see my targets are more than likely going to be the 50% FIB retracement Level. ( The King FIB level )
That is where I take profit no matter what.
PART 2 AB = CD ( The Extension )
Once you establish a nice rejection at either the 50% or 61.8% FIBS It's time to short.
My past experience tells me to trade conservitively but to each their own. You are almost guarnteed going to hit the -.232 extension after every retracement.
The second most likely target is the -61.8% Extension as seen in this chart.
I always take profit at the -.232 extension after a 61.8 and 50% bounce.


Bitcoin Price Recovery Set For New All Time High €7100If this wave of buying contiunes look for €7100 being hit before the close of the month with support of this down at €6528.

Just wanted to share my triangle scalping theory for crude oilThis pattern has brought me great success scalping crude oil.
How to trade it:
Look for an ABCD triangle formation with lower highs and higher lows.
Draw the triangle with extended lines.
Measure the baseline at B and divide it by 2
Add this value to the point of breakout to get a nice padded target to either side
Look out for fakeouts and good luck.
Backtests may occur on the extended lines to the right but moving between them invalidates the triangle and the trade should be closed.

Educational:How to use ABCD Pattern in our analysisStep 1 Define the AB=200.8 pips
Step 2 (Most important)If confirmed that the price will go up for the C!
The height of BC must be(0.618-0.786)of height of AB
Step 3 If CD=AB=200.8 pips.The price will reach to 1.32524

How to Trade the AB=CD PatternHow to Trade the AB=CD Pattern
Hello traders, following up from my previous educational post I received several requests via private message for my take on the AB=CD pattern.
This structure represents the basic foundation for all harmonic patterns, it is one of the classic chart patterns which is repeated over and over again.
It was developed by Scott M. Carney and Larry Pesavento after being originally discovered by H.M Gartley.
Firstly to spot this chart pattern like any other, you need to train the eye. It may be difficult at first but over-time it will become natural through repetition.
How do I measure the move?
Grab your fibonacci retracement tool and draw from point A to point B of the initial move or impulse leg to get point C. This must hit the minimum 0.618 (61.80%) retracement of the A to B move but not exceed 0.786 (78.60%).
A valid C point is illustrated on the chart with two horizontal lines and a grey box.
You're now looking to complete the pattern by locating the D point which is the potential reversal zone (PRZ), this represents a critical area where the flow of buying and selling is potentially changing. The D point is an extension of the A to B move that must hit the minimum 1.272 (127.20%) extension but not exceed 1.618 (161.80%).
A valid D point is illustrated on the chart with two horizontal lines and a grey box.
Or alternatively you can measure this move by using the ABCD pattern tool provided by TradingView.
To summarise, the measurements for a valid AB=CD pattern are detailed below.
C: 0.618 - 0.786
D: 1.272 - 1.618
The measurements for a perfect AB=CD pattern are detailed below.
C: 0.618
D: 1.618
Trading Rules
Wait until the pattern fully completes at the D point before buying or selling.
Here are a few tips on finding a pattern with a higher probability rate (although not essential for a valid pattern):
The length of line AB should be equal to the length of line CD.
The time it takes for the price to move from A to B should be equal to the time it takes for the price to move from C to D.
Stop Loss
When looking to place your stops there are many ways this can be done depending on your trading plan, but it should always be placed below the D point.
Your risk to reward ratio should be a minimum of 1:2 on every trade, if this cannot be achieved then I would not personally take the trade.
Take Profit
When using take profit targets I highly recommend having two and not just one, meaning you can close the trade after your first target has been reached or move your stop loss into profit (risk free trade).
Just like your stop loss there are many ways this can be done depending on your trading plan, but I recommend setting your take profit levels at the highs or lows of C & A.
Timeframes & Currency Pairs
This pattern like any other and is more profitable with certain currency pairs and timeframes, you should do your own back testing before trading the pattern.
Personally speaking this pattern holds and better structure and performs best on higher timeframes such as the 4h and daily rather than the 5m.
To Round Off
I truly hope this post explained how to trade the AB=CD pattern.
I am available via private message for any questions you may have.

ABCD & THREE-DRIVE EXPLAINEDHi Traders,
Please find below three basic trading strategy's that can be implemented to any market on a daily basis.
I have only given out basic information on the ratio's and fibonacci's of the two strategy's, should you need anymore in depth information don't hesitate to contact me.
ABCD Rules Of Engagement:
1. Point C must retrace to a 0.618 of the A - B move
2. Point D must be a 1.272 projection of the B - C move
3. Buy/Sell at the D leg completion.
Three -Drive Rules Of Engagement:
1. Point A should be the 0.618 retracement of drive 1
2 Point B should be the 0.618 retracement of drive 2
3. Drive 3 should be the 1.272 extension of the B correction

3 TRADING STRATEGY'S IN ONE CHART - EXPLAINEDHi Traders,
Please find below three basic trading strategy's that can be implemented to any market on a daily basis.
I have only given out basic information on the ratio's and Fibonacci's of the three strategy's, should you need anymore in depth information don't hesitate to contact me.
2618 Rules Of Engagement:
1. Double top
2. Break & close below neckline / support
3. Sell at 0.618% Fibonacci Retracement
Gartley Pattern Rules Of Engagement:
1. 0.618 Retracement of the X to A leg
2. Atleast a 0.618 Retracement of A to B leg ( can't exceed A )
3. 1.272 Retracement of the B to A leg
4. Buy at the D leg ( 1.272 )
The ABCD Rules Of Engagement:
1. 0.618 Retracement of the A to B leg
2. 1.272 Retracement of the B to C leg
3. Buy at the D leg ( 1.272 )


Educational 05: AB=CD Pattern In this Educational post, I will be sharing the most basic and simple harmonic pattern: AB=CD Pattern
1. Formation of the Pattern
2. What to look in the pattern
3. Targets
This is a new series of Harmonic Patterns , where I shall be discussing about the below patterns:
1. AB=CD Pattern
2. Gartley Pattern
3. Cypher Pattern
4. Bat Pattern
5. Butterfly Pattern
The best part of the above mentioned patterns that they can be used in all markets and at any time frame. It means you can use the patterns in stock markets, Forex , Commodities and at any time frame like hourly, daily, weekly etc. Therefore, they are important tools when analyzing the charts.
Purpose: To provide information to traders community that can help individual trader to learn more and take inform decisions while trading in order to generate consistent positive results.
Practice the above said chart pattern and share it below with us.
Thanks,
Best Regards,
Neetesh Jain

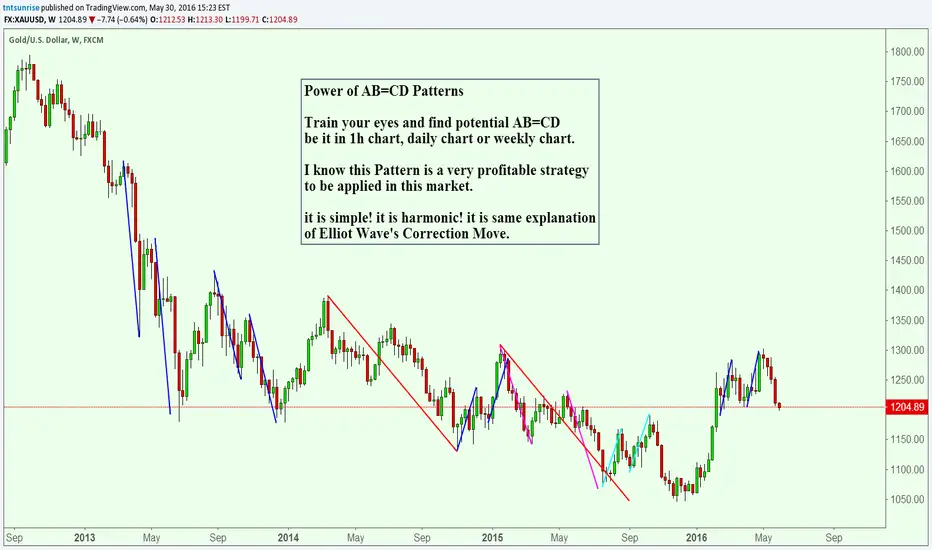
Educational Study: Power of AB=CD PatternsPower of AB=CD Patterns
Train your eyes and find potential AB=CD
be it in 1h chart, daily chart or weekly chart.
I know this Pattern is a very profitable strategy
to be applied in this market.
it is simple! it is harmonic! it is same explanation
of Elliot Wave's Correction Move.
AB=CD "Harmonic Trading" Mr. CarneyThis is a summery of Mr. Carney book "Harmonic Trading". AB=CD chapter.

AB=CD & Gartley Patterns // Educational ®Hi Traders,
The idea is to share a tiny portion of the study of Larry Pesavento and Leslie Jouflas about the AB=CD and the Gartley Patterns, with those who are introducing the advanced patterns in your trading method;
You will have a lot of information about those guys on the web.
Special Thanks to Alexander_Nikitin (www.tradingview.com)
Please enjoy ;)
Safe Trades;

